P Project 2025
Summary
Project results comparing three target scopes (N Only, N+P, P Only) under three model variants:
Old RetentionNew RetentionNew Retention + Differentiation
The central comparison workbook is TargetEcon_Scenario_Comparison_v4.xlsx.
Open Scenario Results
Use the detailed run page for national totals, top-cost measures, figure previews, and direct workbook downloads.
Download Comparison Workbook
The master Excel file compares all three target scopes across old, new, and differentiated retention assumptions.
Raw source folder
raw/Projects/P Project 2025/- Ingested run folder:
raw/Projects/P Project 2025/Scenario 1/
Scenario runs
| Scenario run | Status | Contents | Page |
|---|---|---|---|
| Scenario 1 | Ingested | 9 result workbooks, 1 comparison workbook, 23 figures | Scenario 1 |
Cross-run findings
N+Pis the only scope with a material national cost saving fromNew Retentionrelative toOld Retention:-3.58 mDKK/yr.- Adding
Differentiationpartly offsets that saving inN+P(+1.65 mDKK/yrvsNew Retention) but the run still remains cheaper thanOld Retentionby1.92 mDKK/yr. N Onlycosts are almost unchanged by the retention/differentiation updates, but total selected area rises sharply from595.7 khato roughly634–635 kha.P Onlycosts stay almost flat around299.2–299.5 mDKK/yr, while N side-effects increase from1.325 kt N/yrto about1.43 kt N/yr.- Across all scopes, the cost structure is still dominated by
FO,LRh,WL, andMW(VP3)rather than by the pure P measures alone.
Representative figures
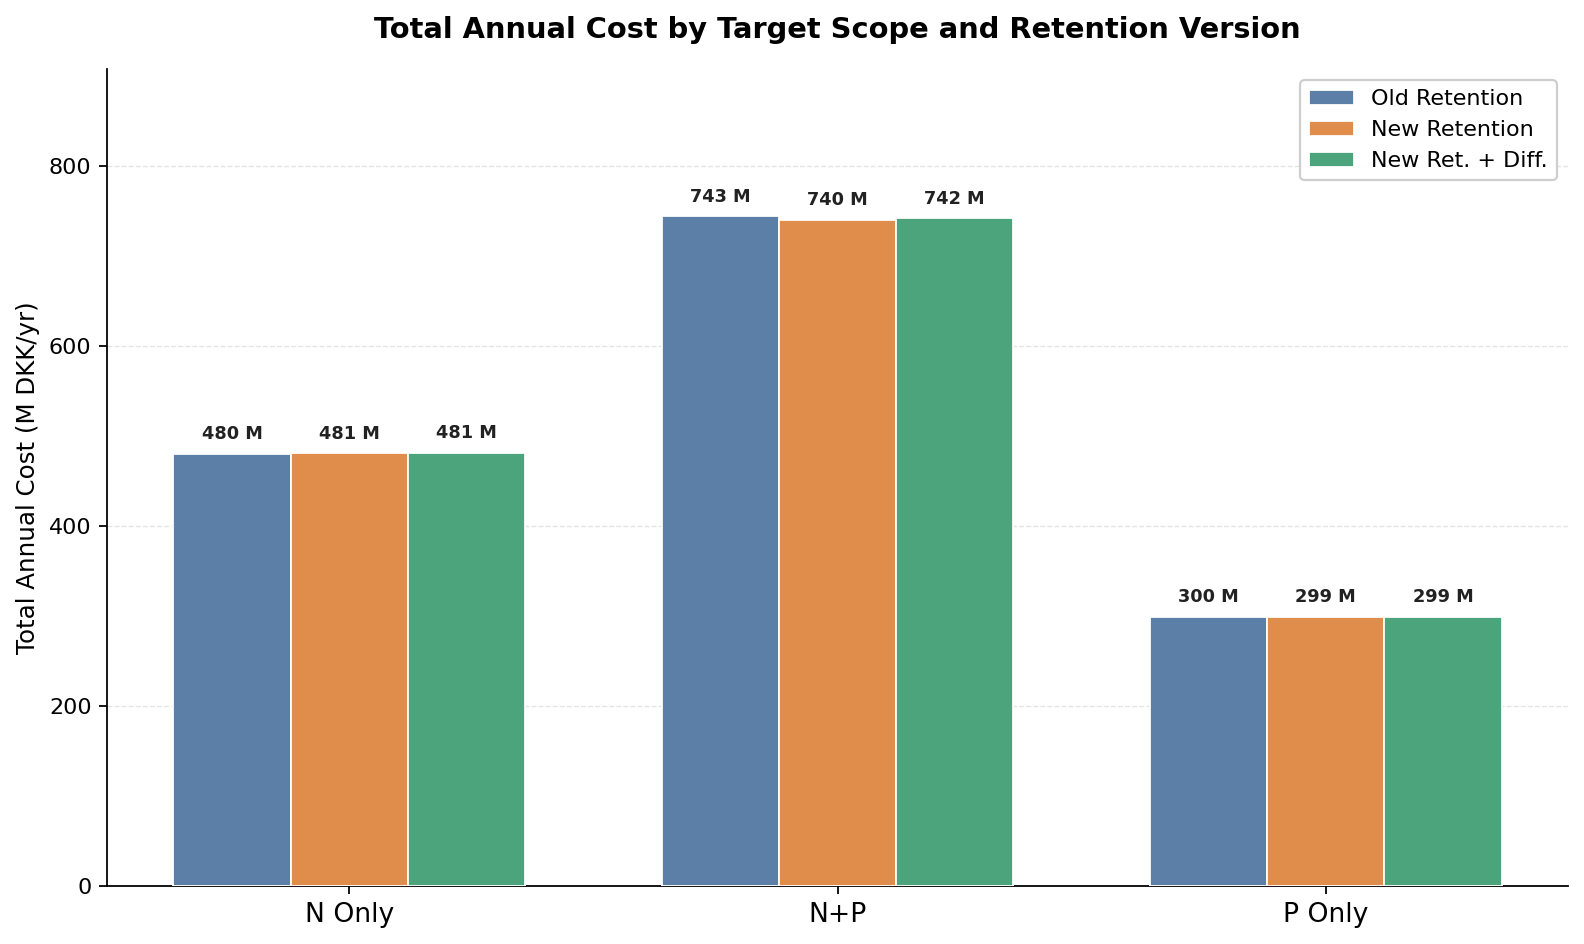
Total cost
Click to open the full-size figure.
Click to open the full-size figure.
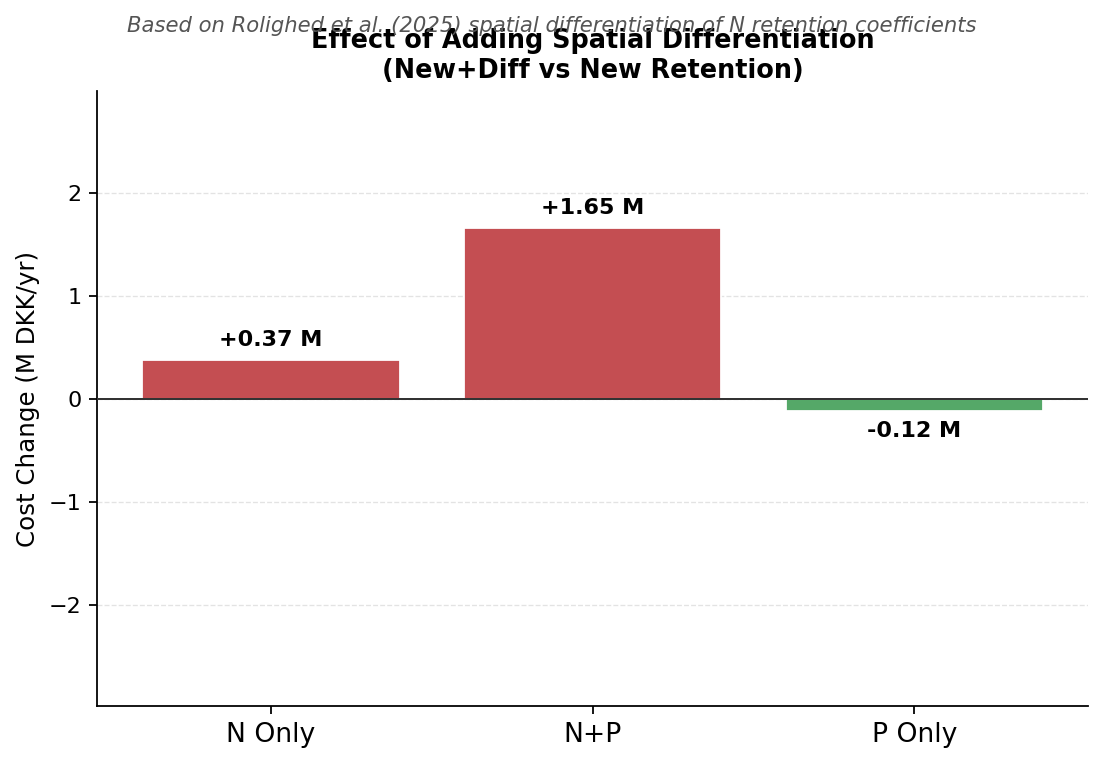
Differentiation effect
Click to open the full-size figure.
Click to open the full-size figure.
Notes
- This project page is a landing page. Detailed interpretation of the comparison workbook lives on Scenario 1.
- Results are documented as ingested outputs. They are not yet folded back into the generic scenario pages under
wiki/scenarios/.