P Project 2025 — Scenario 1
Purpose
This run package compares the national results of three target scopes across three model versions:
N OnlyN+PP Only
Each scope is evaluated under:
Old RetentionNew RetentionNew Retention + Differentiation
The framing comes directly from the comparison workbook title: "Impact of Retention & Differentiation Updates".
Source files
Master comparison workbook
Master Comparison Workbook
Main analysis file with measure groups, national totals, measure detail, coastal results, and lake-area breakdowns.
How workbook links behave
The `.xlsx` files are published and clickable. In a browser they will normally download or open in your spreadsheet application rather than render as web pages.
Individual result workbooks
Quick downloads
National results
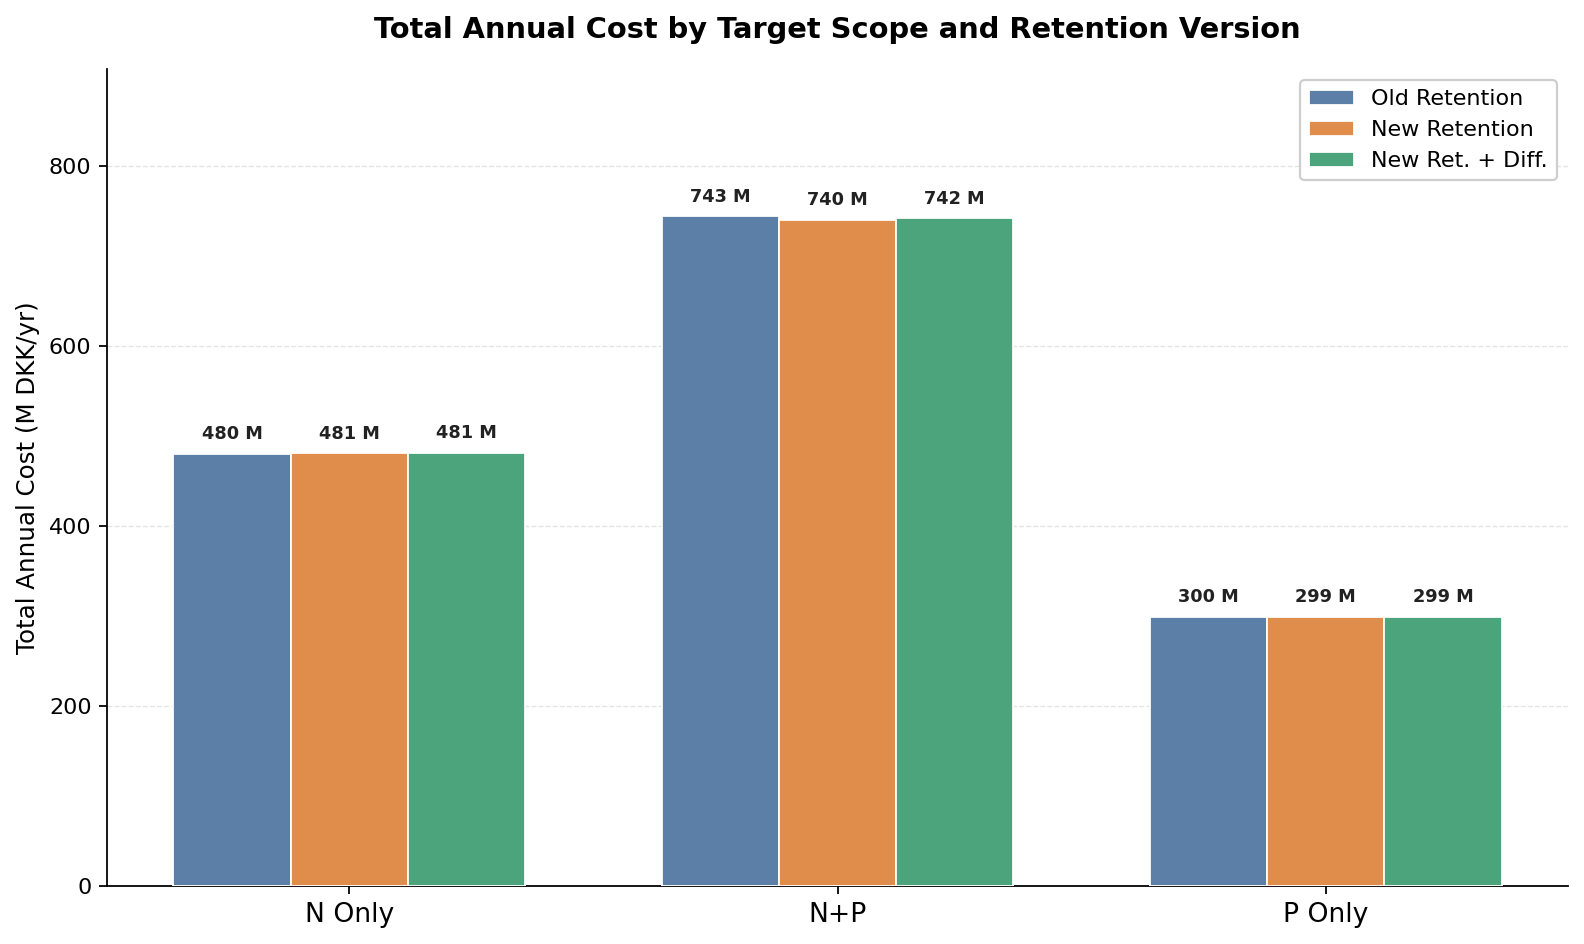
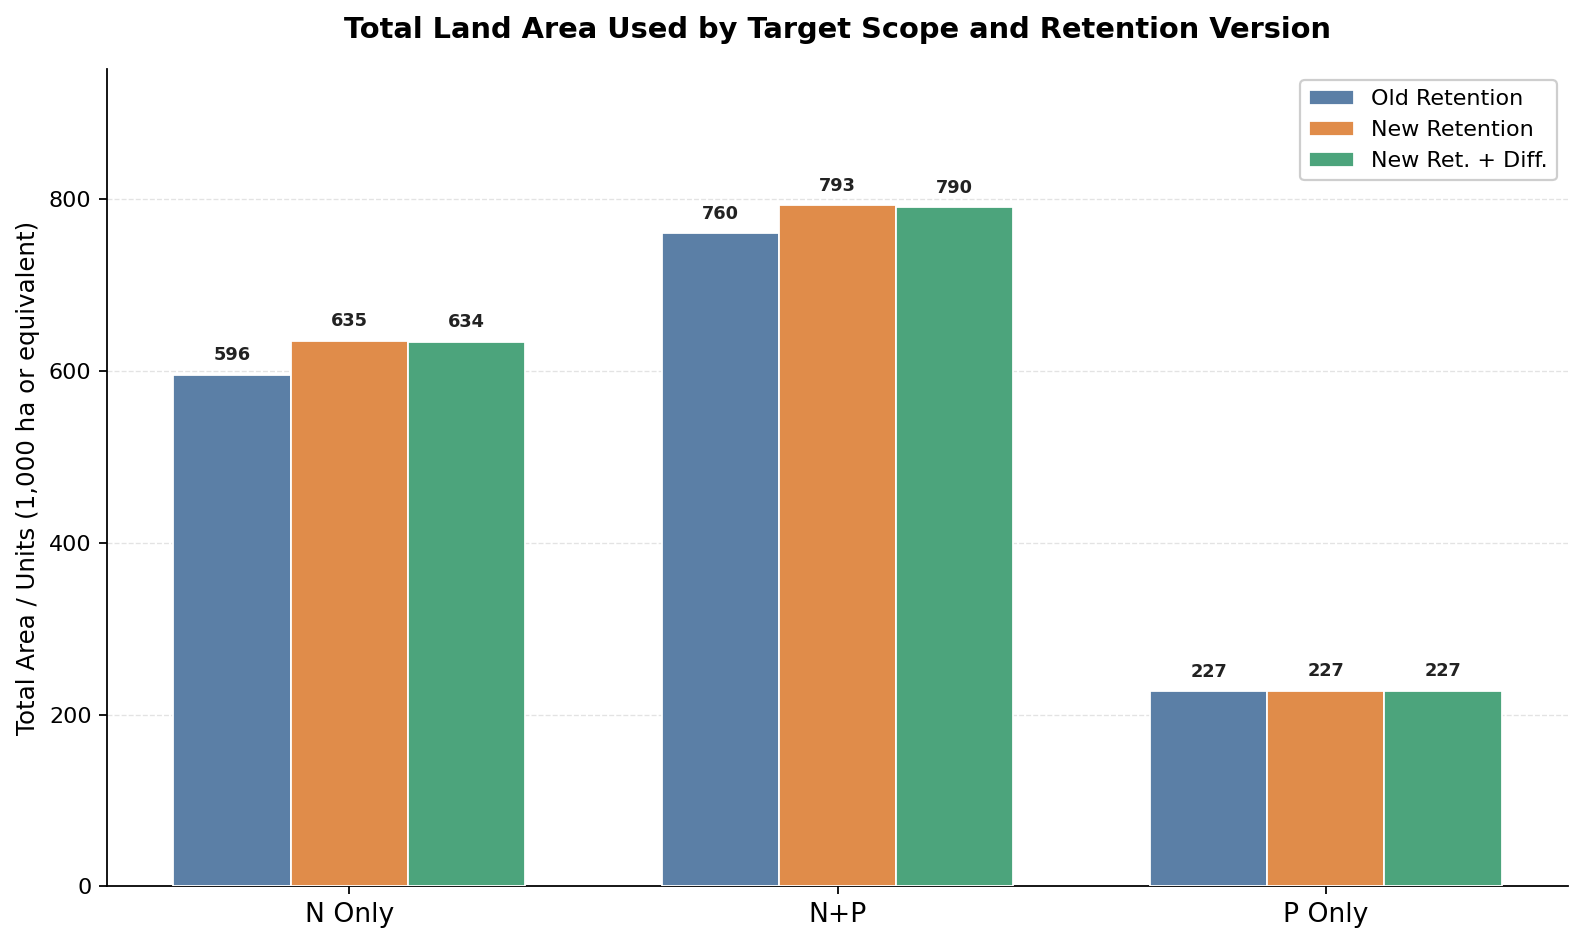
Values below are transcribed from sheet 1. National Totals in the master comparison workbook. Costs are shown in mDKK/yr, reductions in tons/yr, and area in 1,000 ha.
| Scope | Version | Cost | Δ vs Old | Δ vs New | N reduced | P reduced | Total area |
|---|---|---|---|---|---|---|---|
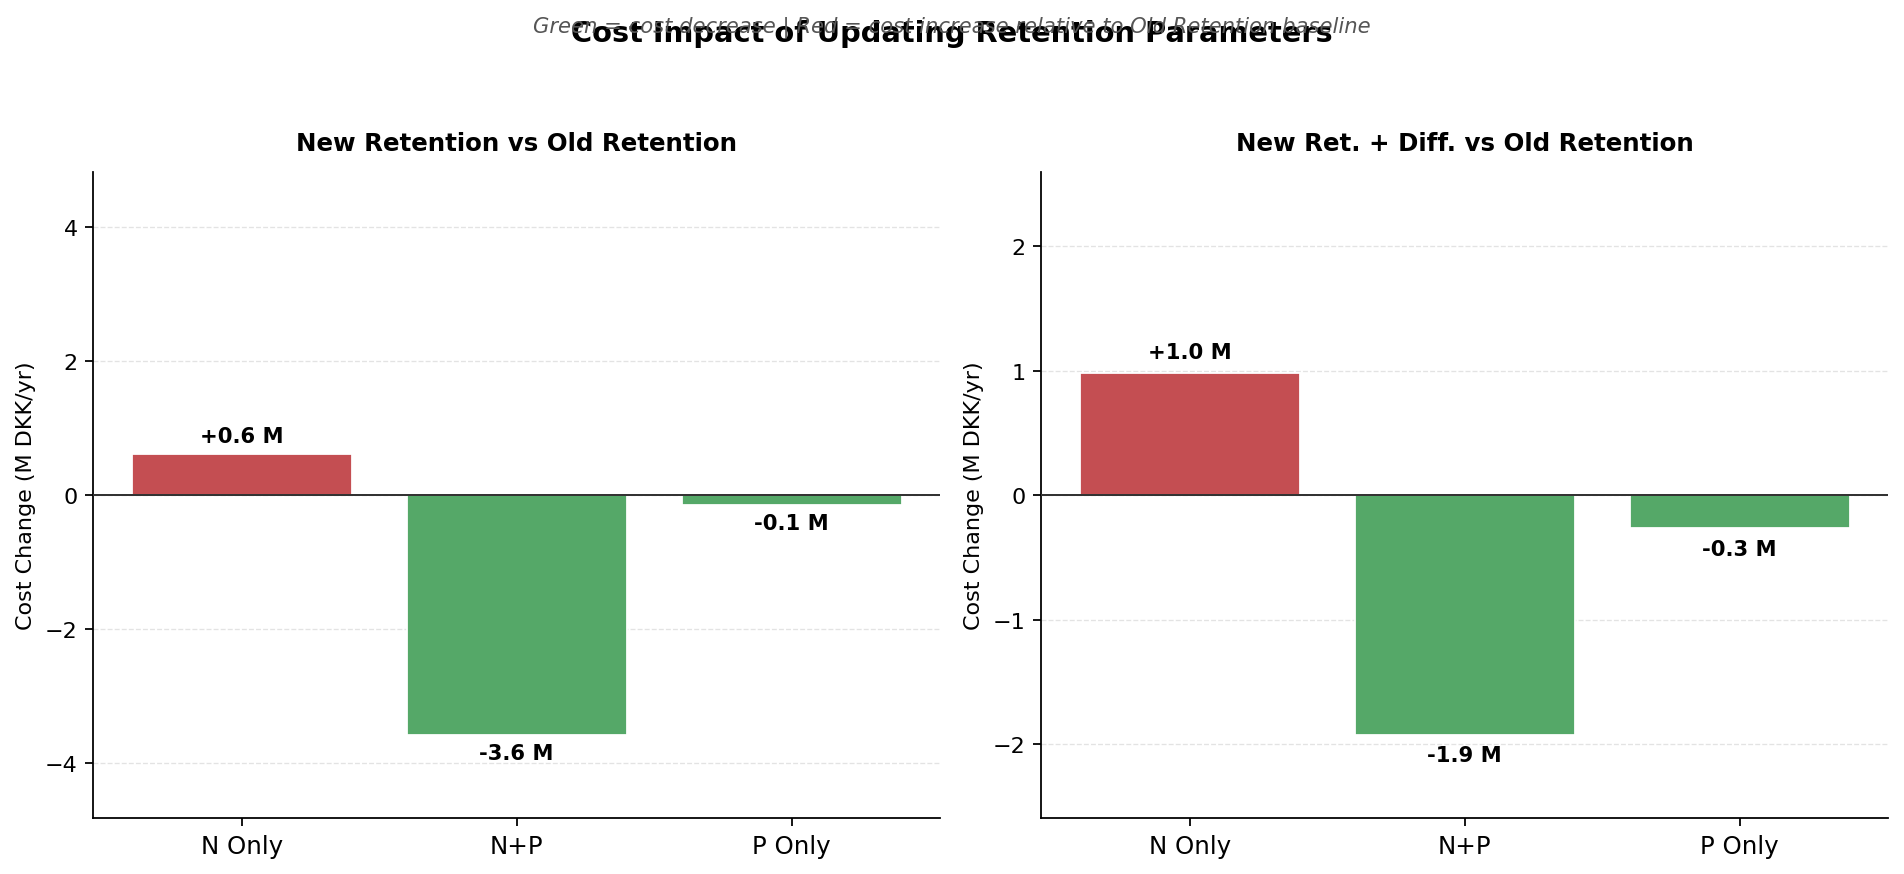
| N Only | Old Retention | 480.238 | — | — | 13,794.6 | 10.2 | 595.7 |
| N Only | New Retention | 480.849 | 0.611 | — | 13,789.3 | 13.7 | 635.3 |
| N Only | New Ret. + Diff. | 481.223 | 0.985 | 0.374 | 13,789.3 | 13.6 | 633.6 |
| N+P | Old Retention | 743.452 | — | — | 14,046.4 | 76.8 | 760.3 |
| N+P | New Retention | 739.875 | -3.577 | — | 14,033.4 | 78.9 | 792.7 |
| N+P | New Ret. + Diff. | 741.529 | -1.923 | 1.654 | 14,038.3 | 78.8 | 790.5 |
| P Only | Old Retention | 299.504 | — | — | 1,324.9 | 68.6 | 227.4 |
| P Only | New Retention | 299.355 | -0.149 | — | 1,428.0 | 68.6 | 227.3 |
| P Only | New Ret. + Diff. | 299.237 | -0.267 | -0.118 | 1,431.1 | 68.7 | 227.3 |
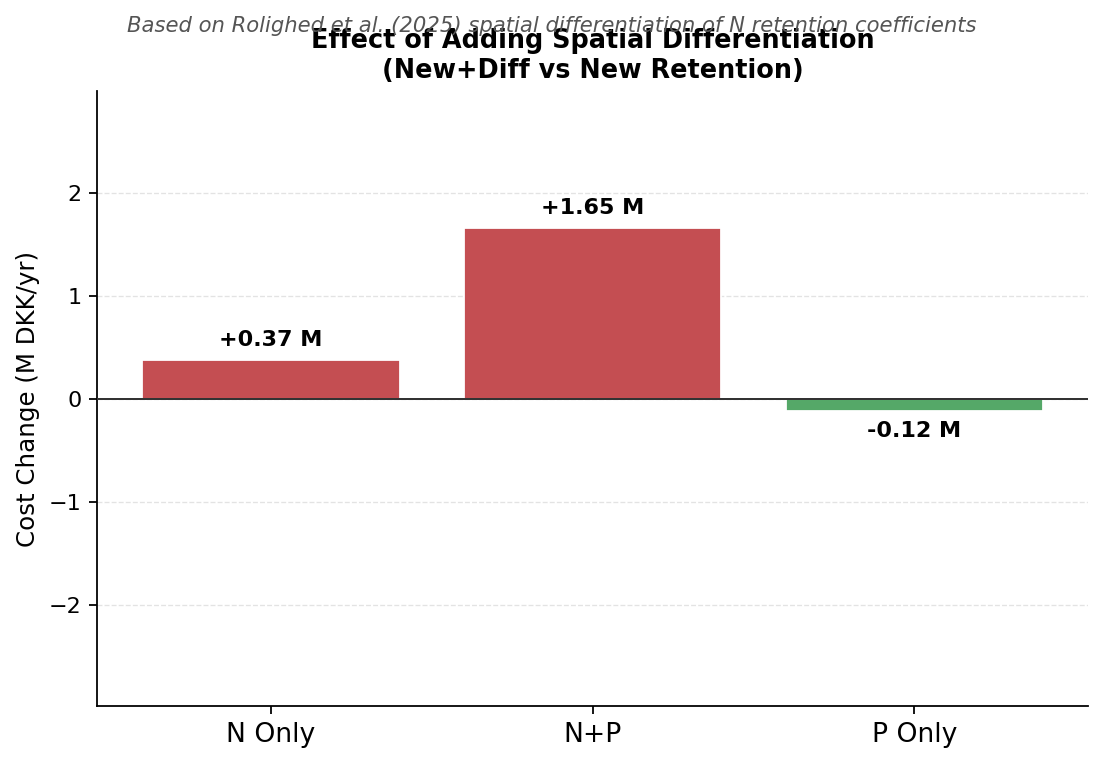
Main findings
New Retentionlowers national cost inN+Pby3.58 mDKK/yrrelative toOld Retention, while increasing total P reduction by roughly2.12 tons/yr.- In
N Only, the cost effect is negligible, but the selected measure area jumps by about39.6 khaunderNew Retention. - Adding
Differentiationhas a small national effect inN Only(+0.37 mDKK/yrvsNew Retention) and a moderate one inN+P(+1.65 mDKK/yr), but slightly lowers cost inP Only(-0.12 mDKK/yrvsNew Retention). P Onlystill generates substantial N side-effects: about1.32–1.43 kt N/yrdepending on retention version.
Cost structure by measure group
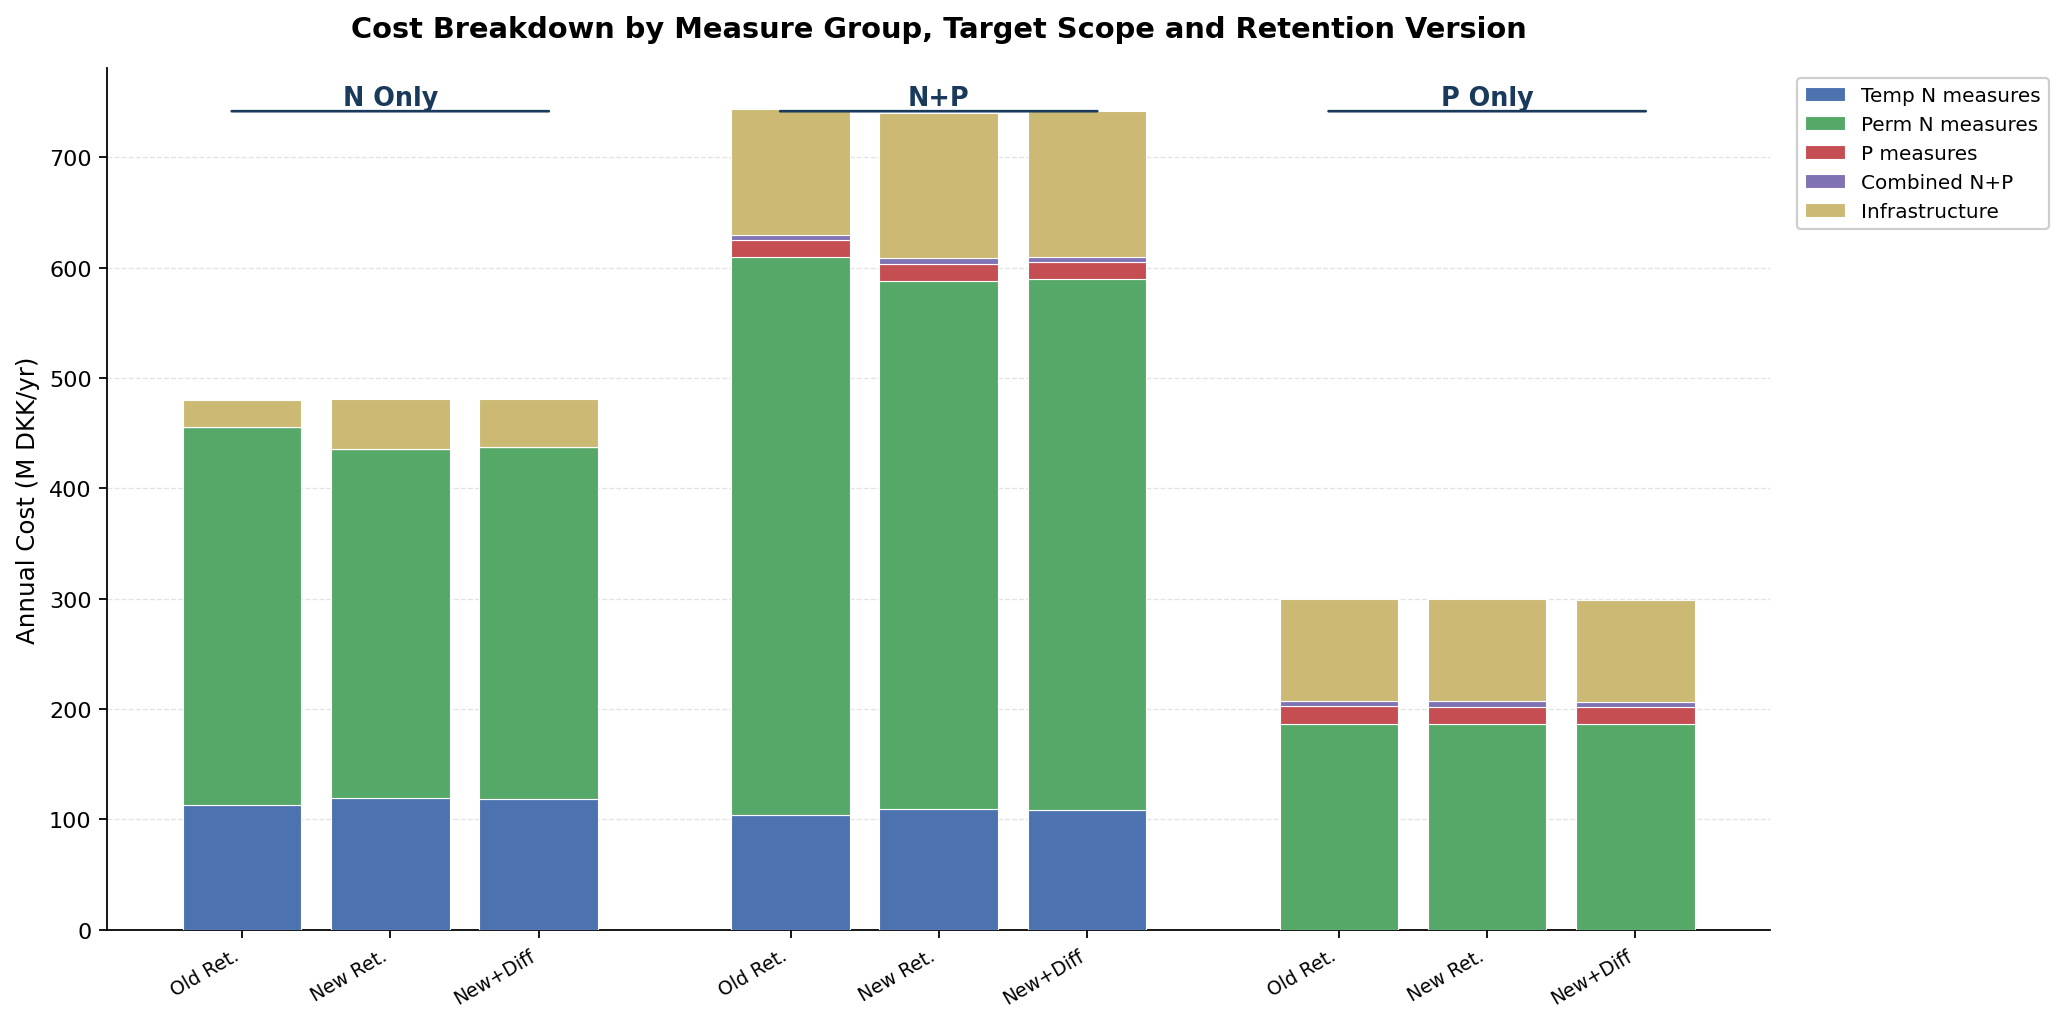
Values below are from sheet 2. Cost by Measure Group in the master comparison workbook, shown in mDKK/yr.
| Scope | Group | Old | New | New + Diff. |
|---|---|---|---|---|
| N Only | Temp N measures | 113.443 | 119.470 | 118.351 |
| N Only | Perm N measures | 342.320 | 316.140 | 318.905 |
| N Only | Infrastructure | 24.431 | 45.204 | 43.924 |
| N+P | Temp N measures | 104.451 | 109.912 | 108.705 |
| N+P | Perm N measures | 505.294 | 478.296 | 481.196 |
| N+P | P measures | 15.233 | 15.309 | 15.256 |
| N+P | Combined N+P | 4.731 | 4.718 | 4.744 |
| N+P | Infrastructure | 113.744 | 131.639 | 131.628 |
| P Only | Perm N measures | 186.785 | 186.668 | 186.292 |
| P Only | P measures | 15.644 | 15.654 | 15.703 |
| P Only | Combined N+P | 4.859 | 4.877 | 4.827 |
| P Only | Infrastructure | 92.216 | 92.156 | 92.415 |
Interpretation
- The retention update shifts spending from
Perm N measurestowardInfrastructurein bothN OnlyandN+P. P Onlyis not a pure P-measures portfolio in cost terms. It is still dominated byPerm N measuresandInfrastructure.
Highest-cost measures
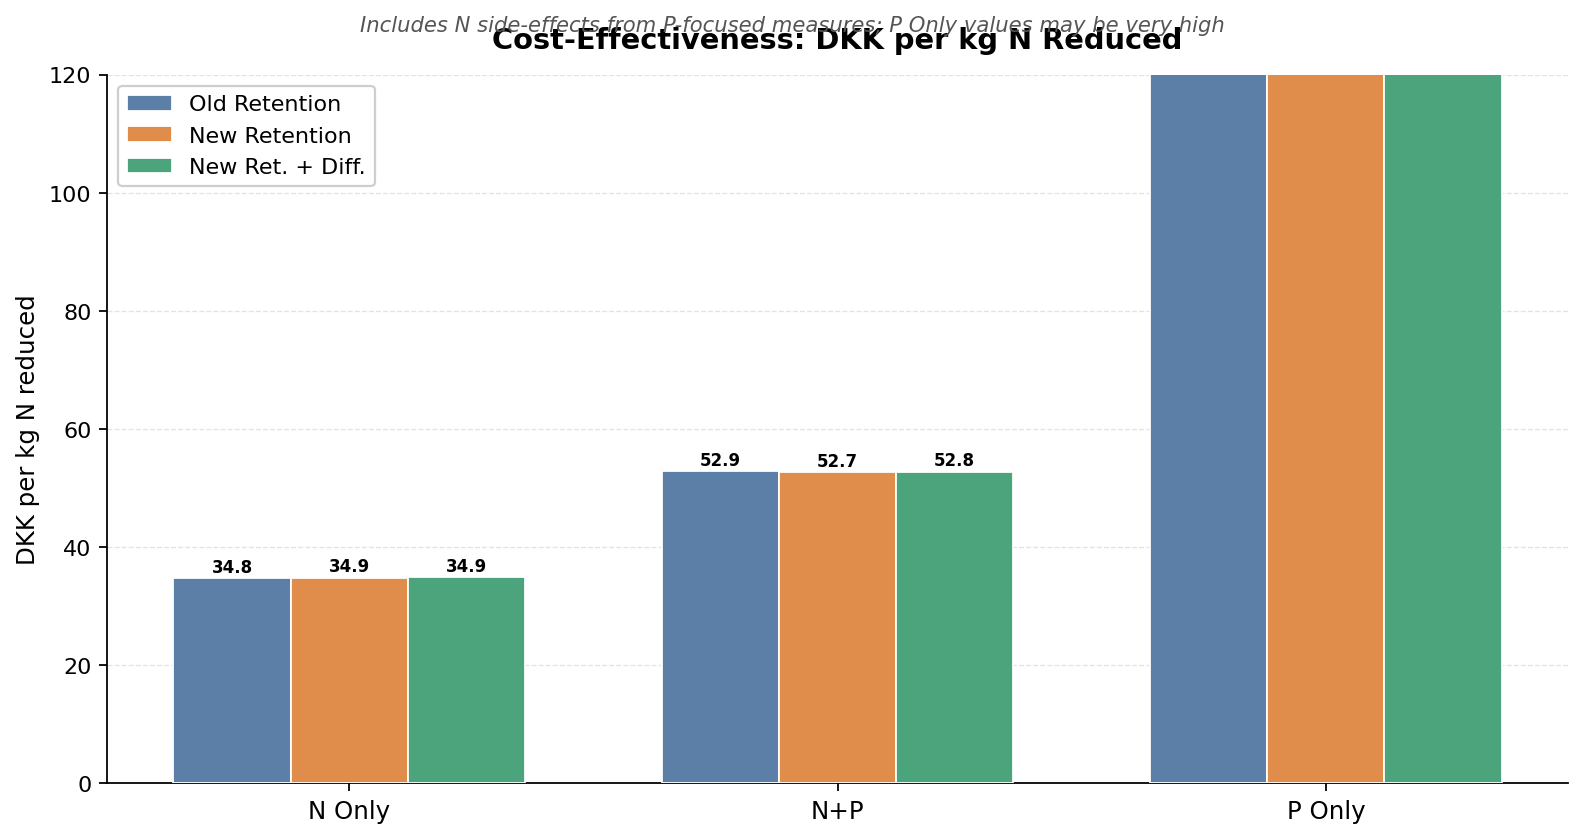
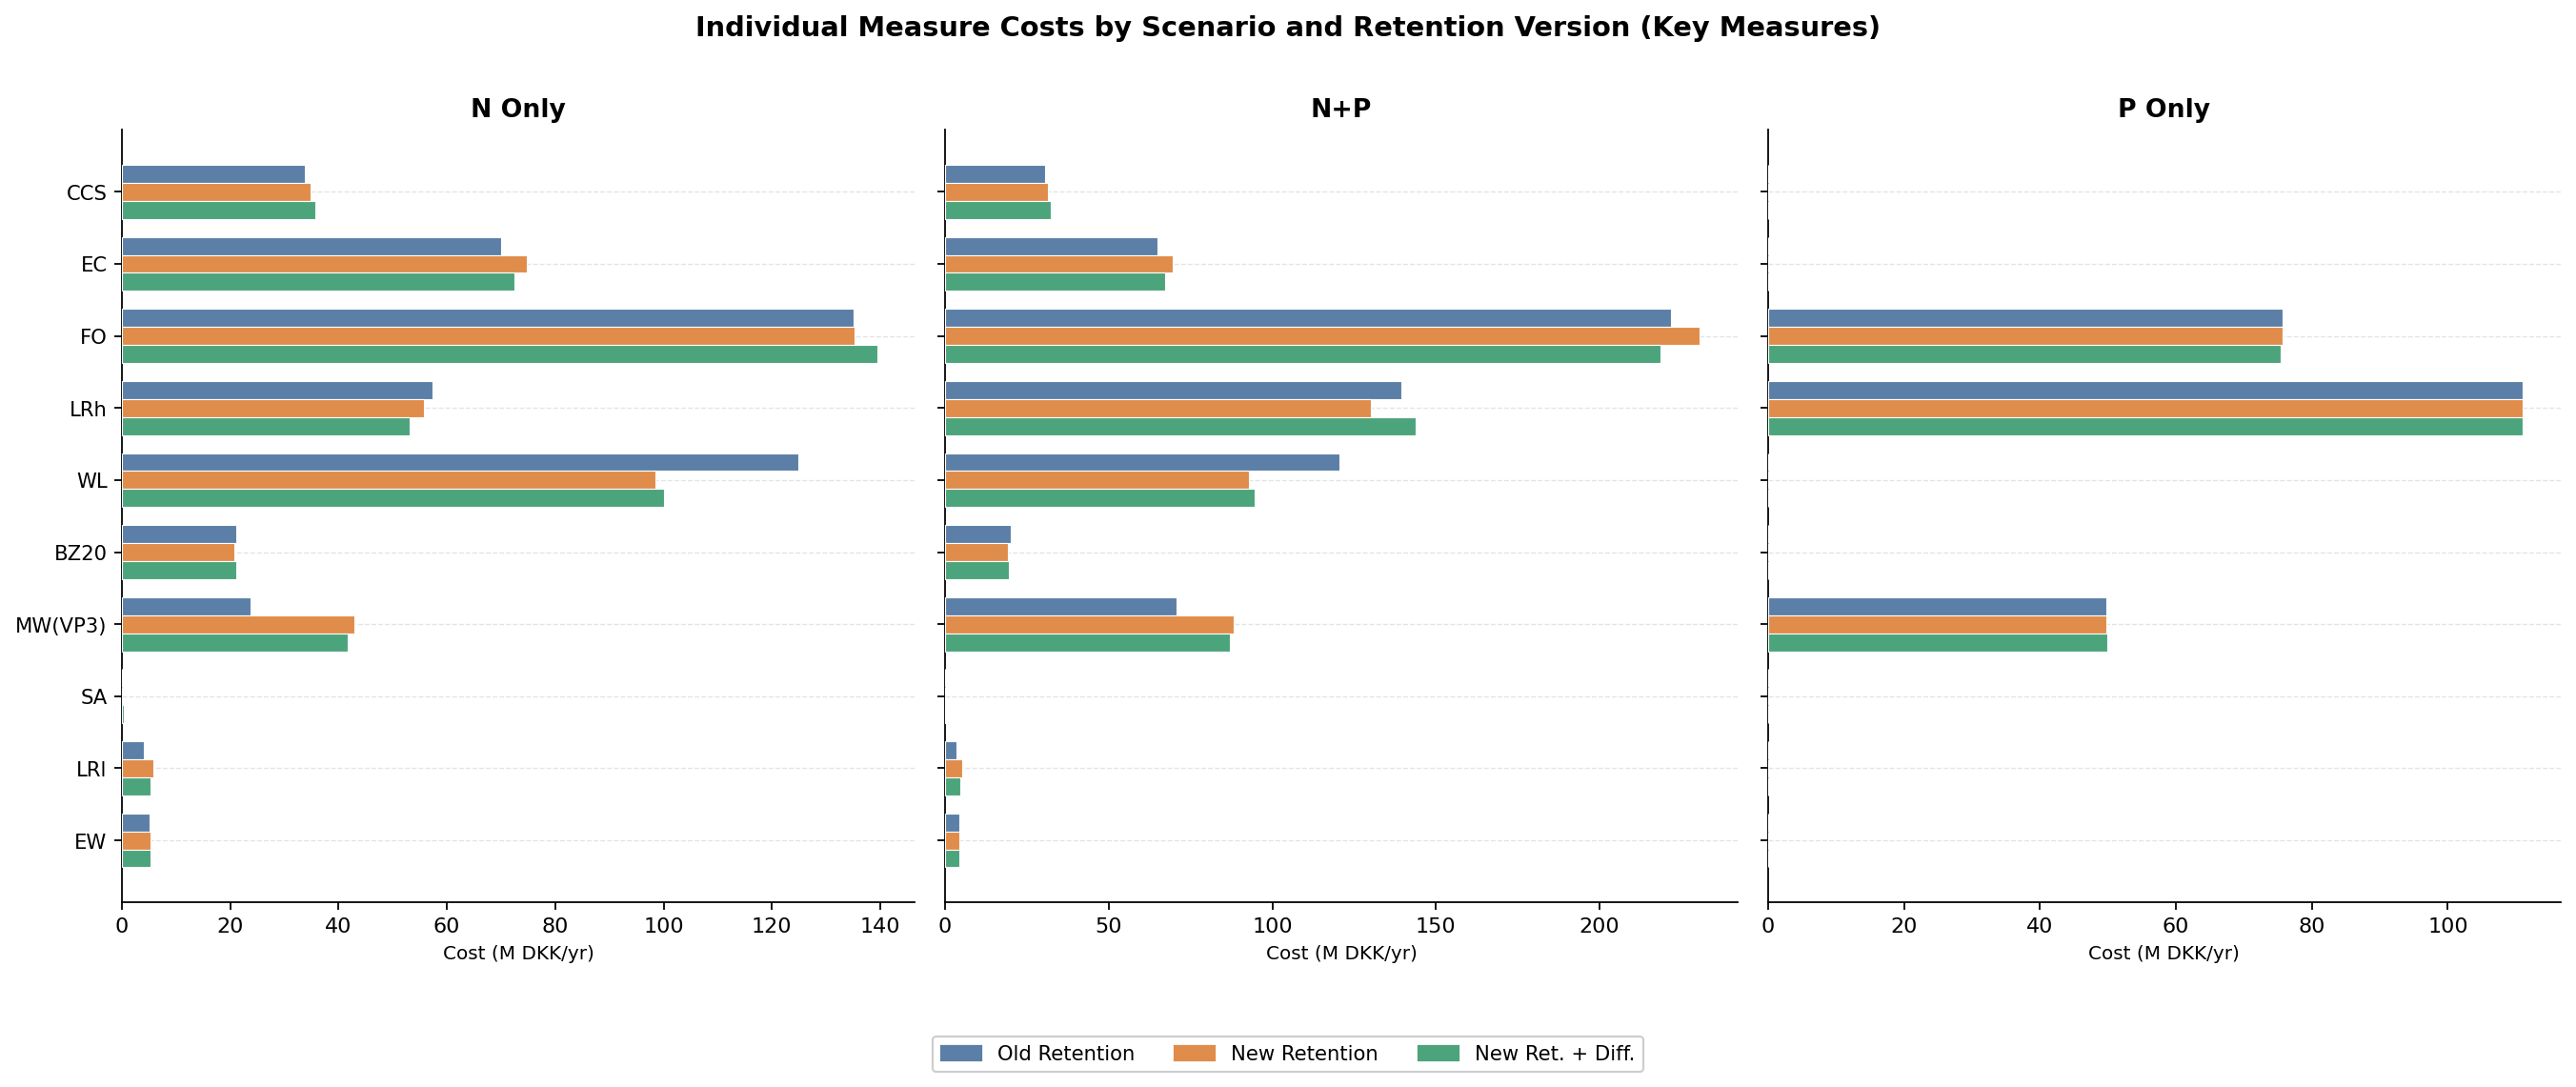
These are the top five measures by annual national cost from sheet 3. Measure Detail.
| Scope | Version | Top-cost measures |
|---|---|---|
| N Only | Old Retention | FO (135.1), WL (124.8), EC (70.0), LRh (57.3), CCS (33.7) |
| N Only | New Retention | FO (135.3), WL (98.6), EC (74.7), LRh (55.8), MW(VP3) (43.0) |
| N Only | New + Diff. | FO (139.4), WL (100.1), EC (72.5), LRh (53.1), MW(VP3) (41.7) |
| N+P | Old Retention | FO (221.9), LRh (139.4), WL (120.4), MW(VP3) (70.7), EC (65.0) |
| N+P | New Retention | FO (230.7), LRh (130.3), WL (92.9), MW(VP3) (88.3), EC (69.7) |
| N+P | New + Diff. | FO (218.6), LRh (143.7), WL (94.6), MW(VP3) (87.0), EC (67.4) |
| P Only | Old Retention | LRh (111.1), FO (75.7), MW(VP3) (49.8), Overflow (22.2), PWET (12.7) |
| P Only | New Retention | LRh (111.0), FO (75.6), MW(VP3) (49.8), Overflow (22.2), PWET (12.7) |
| P Only | New + Diff. | LRh (110.9), FO (75.3), MW(VP3) (49.8), Overflow (22.4), PWET (12.7) |
Numbers are mDKK/yr.
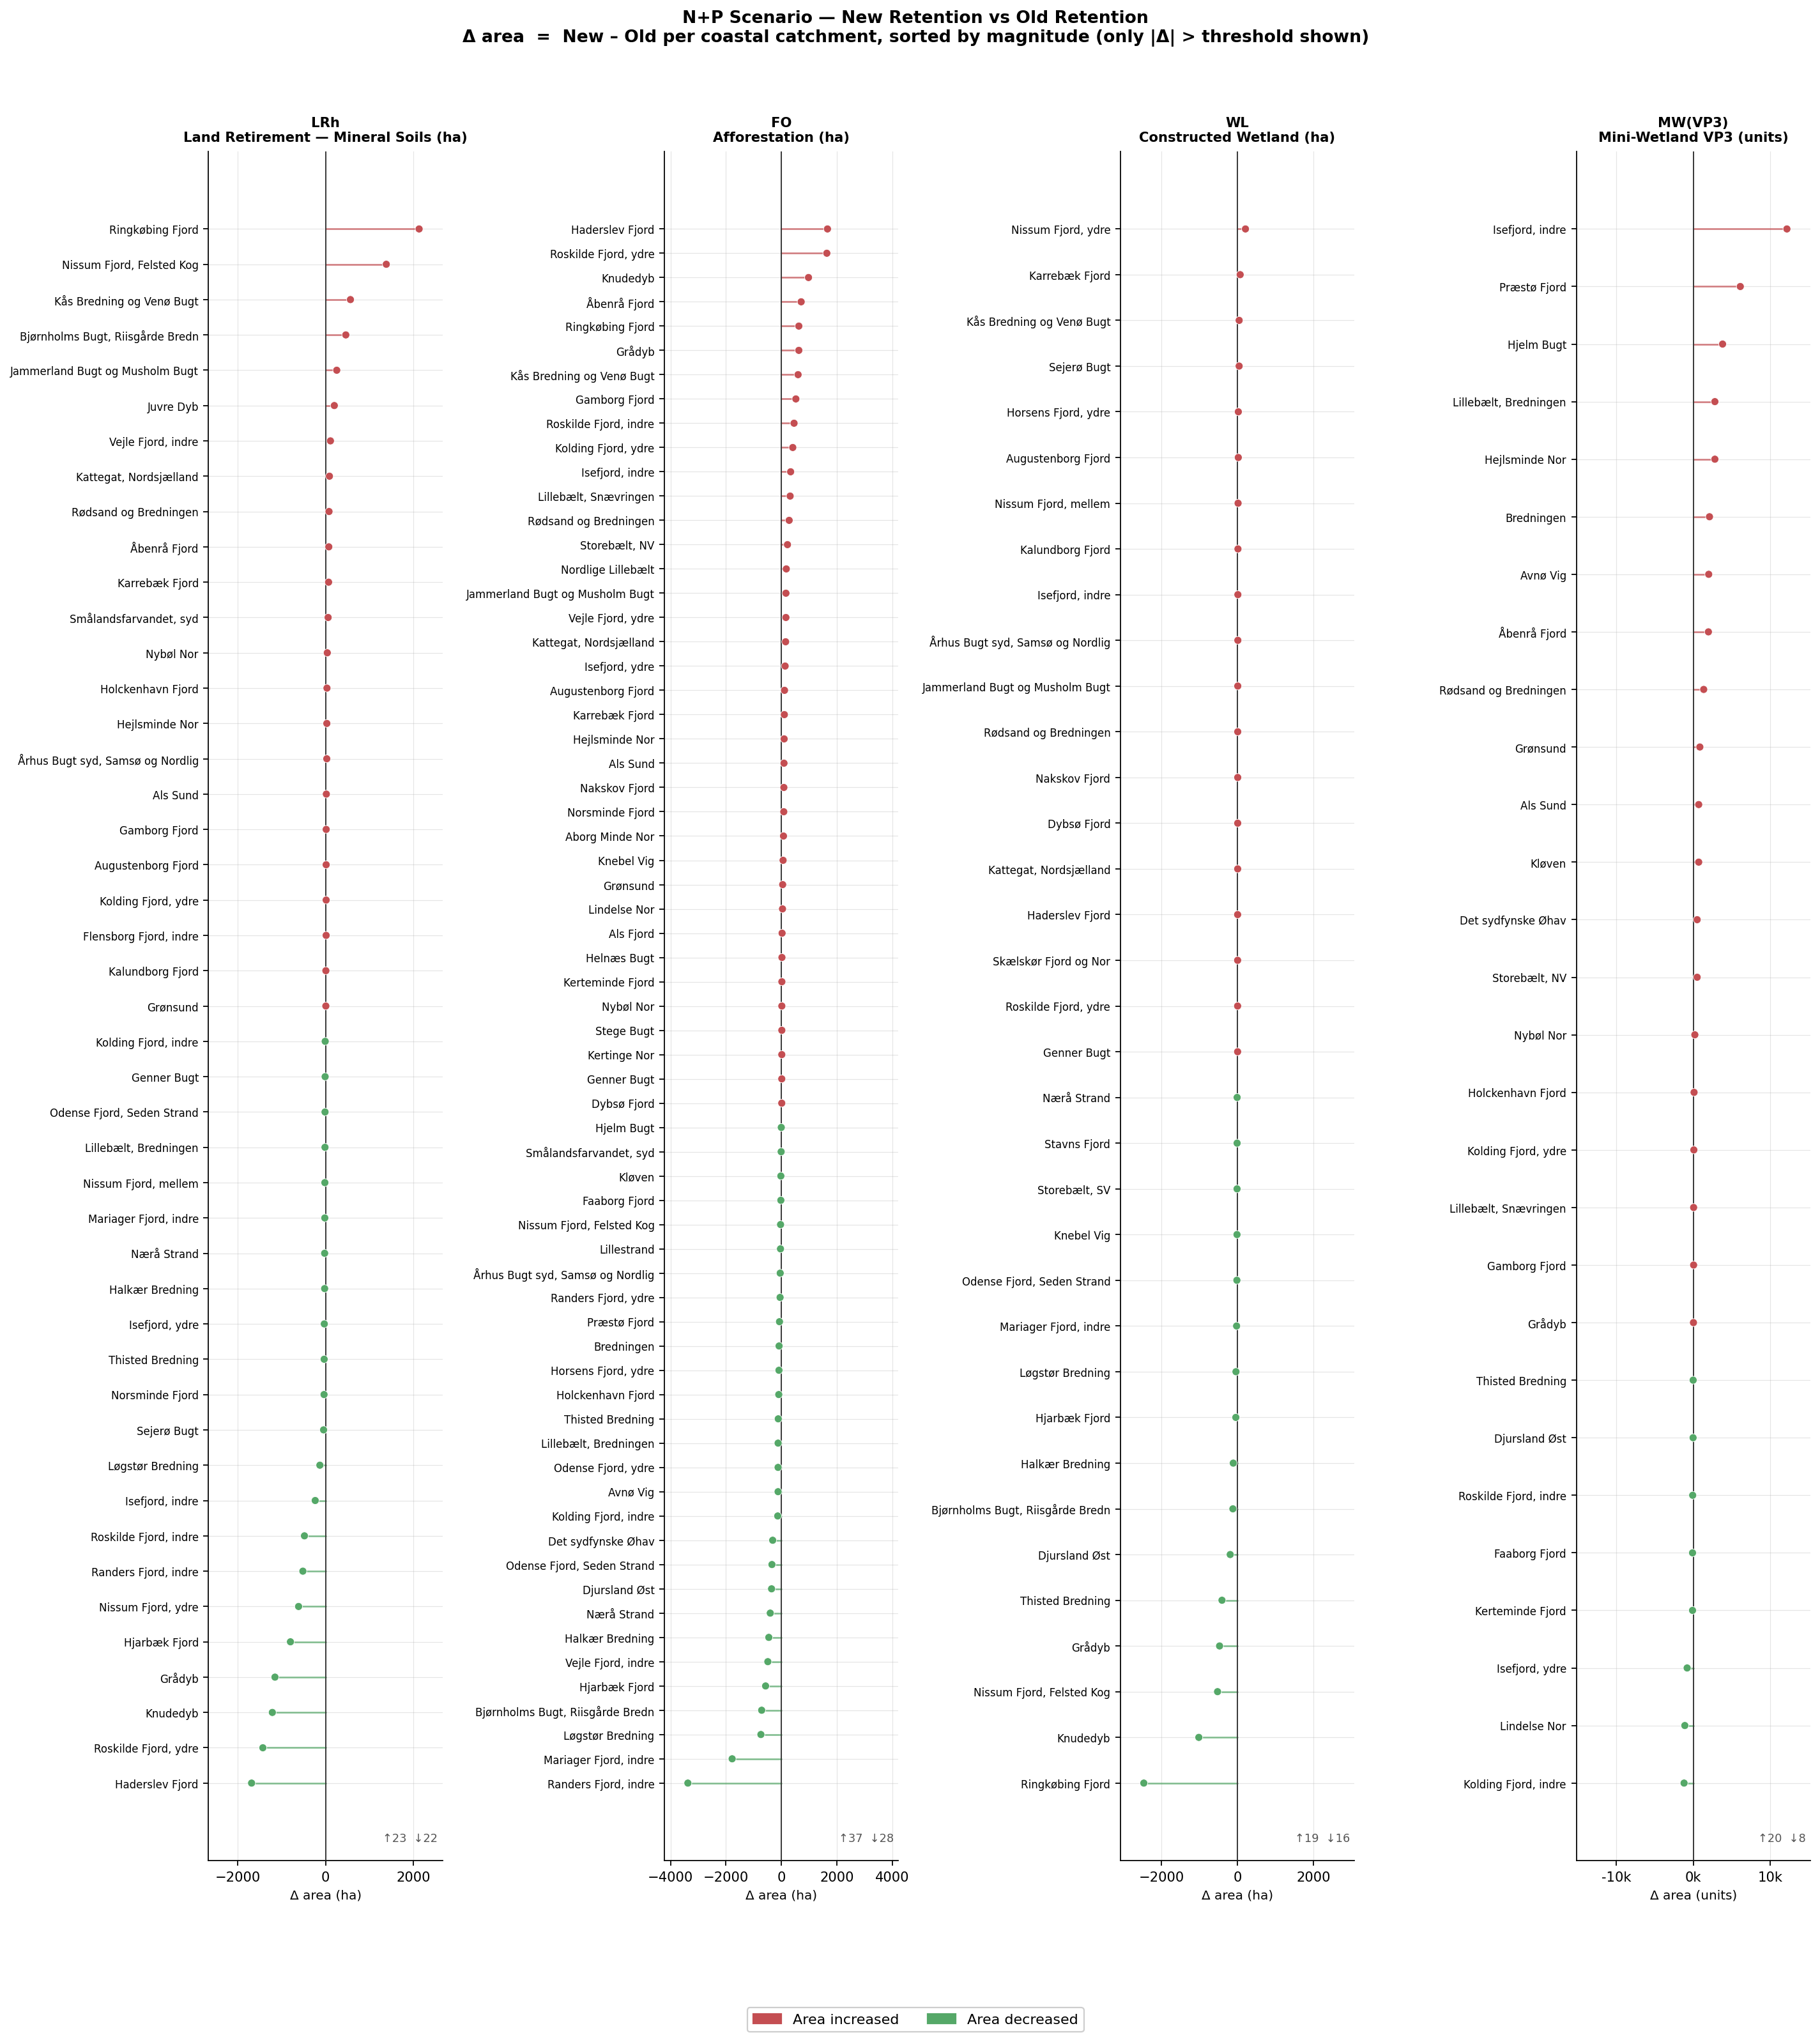
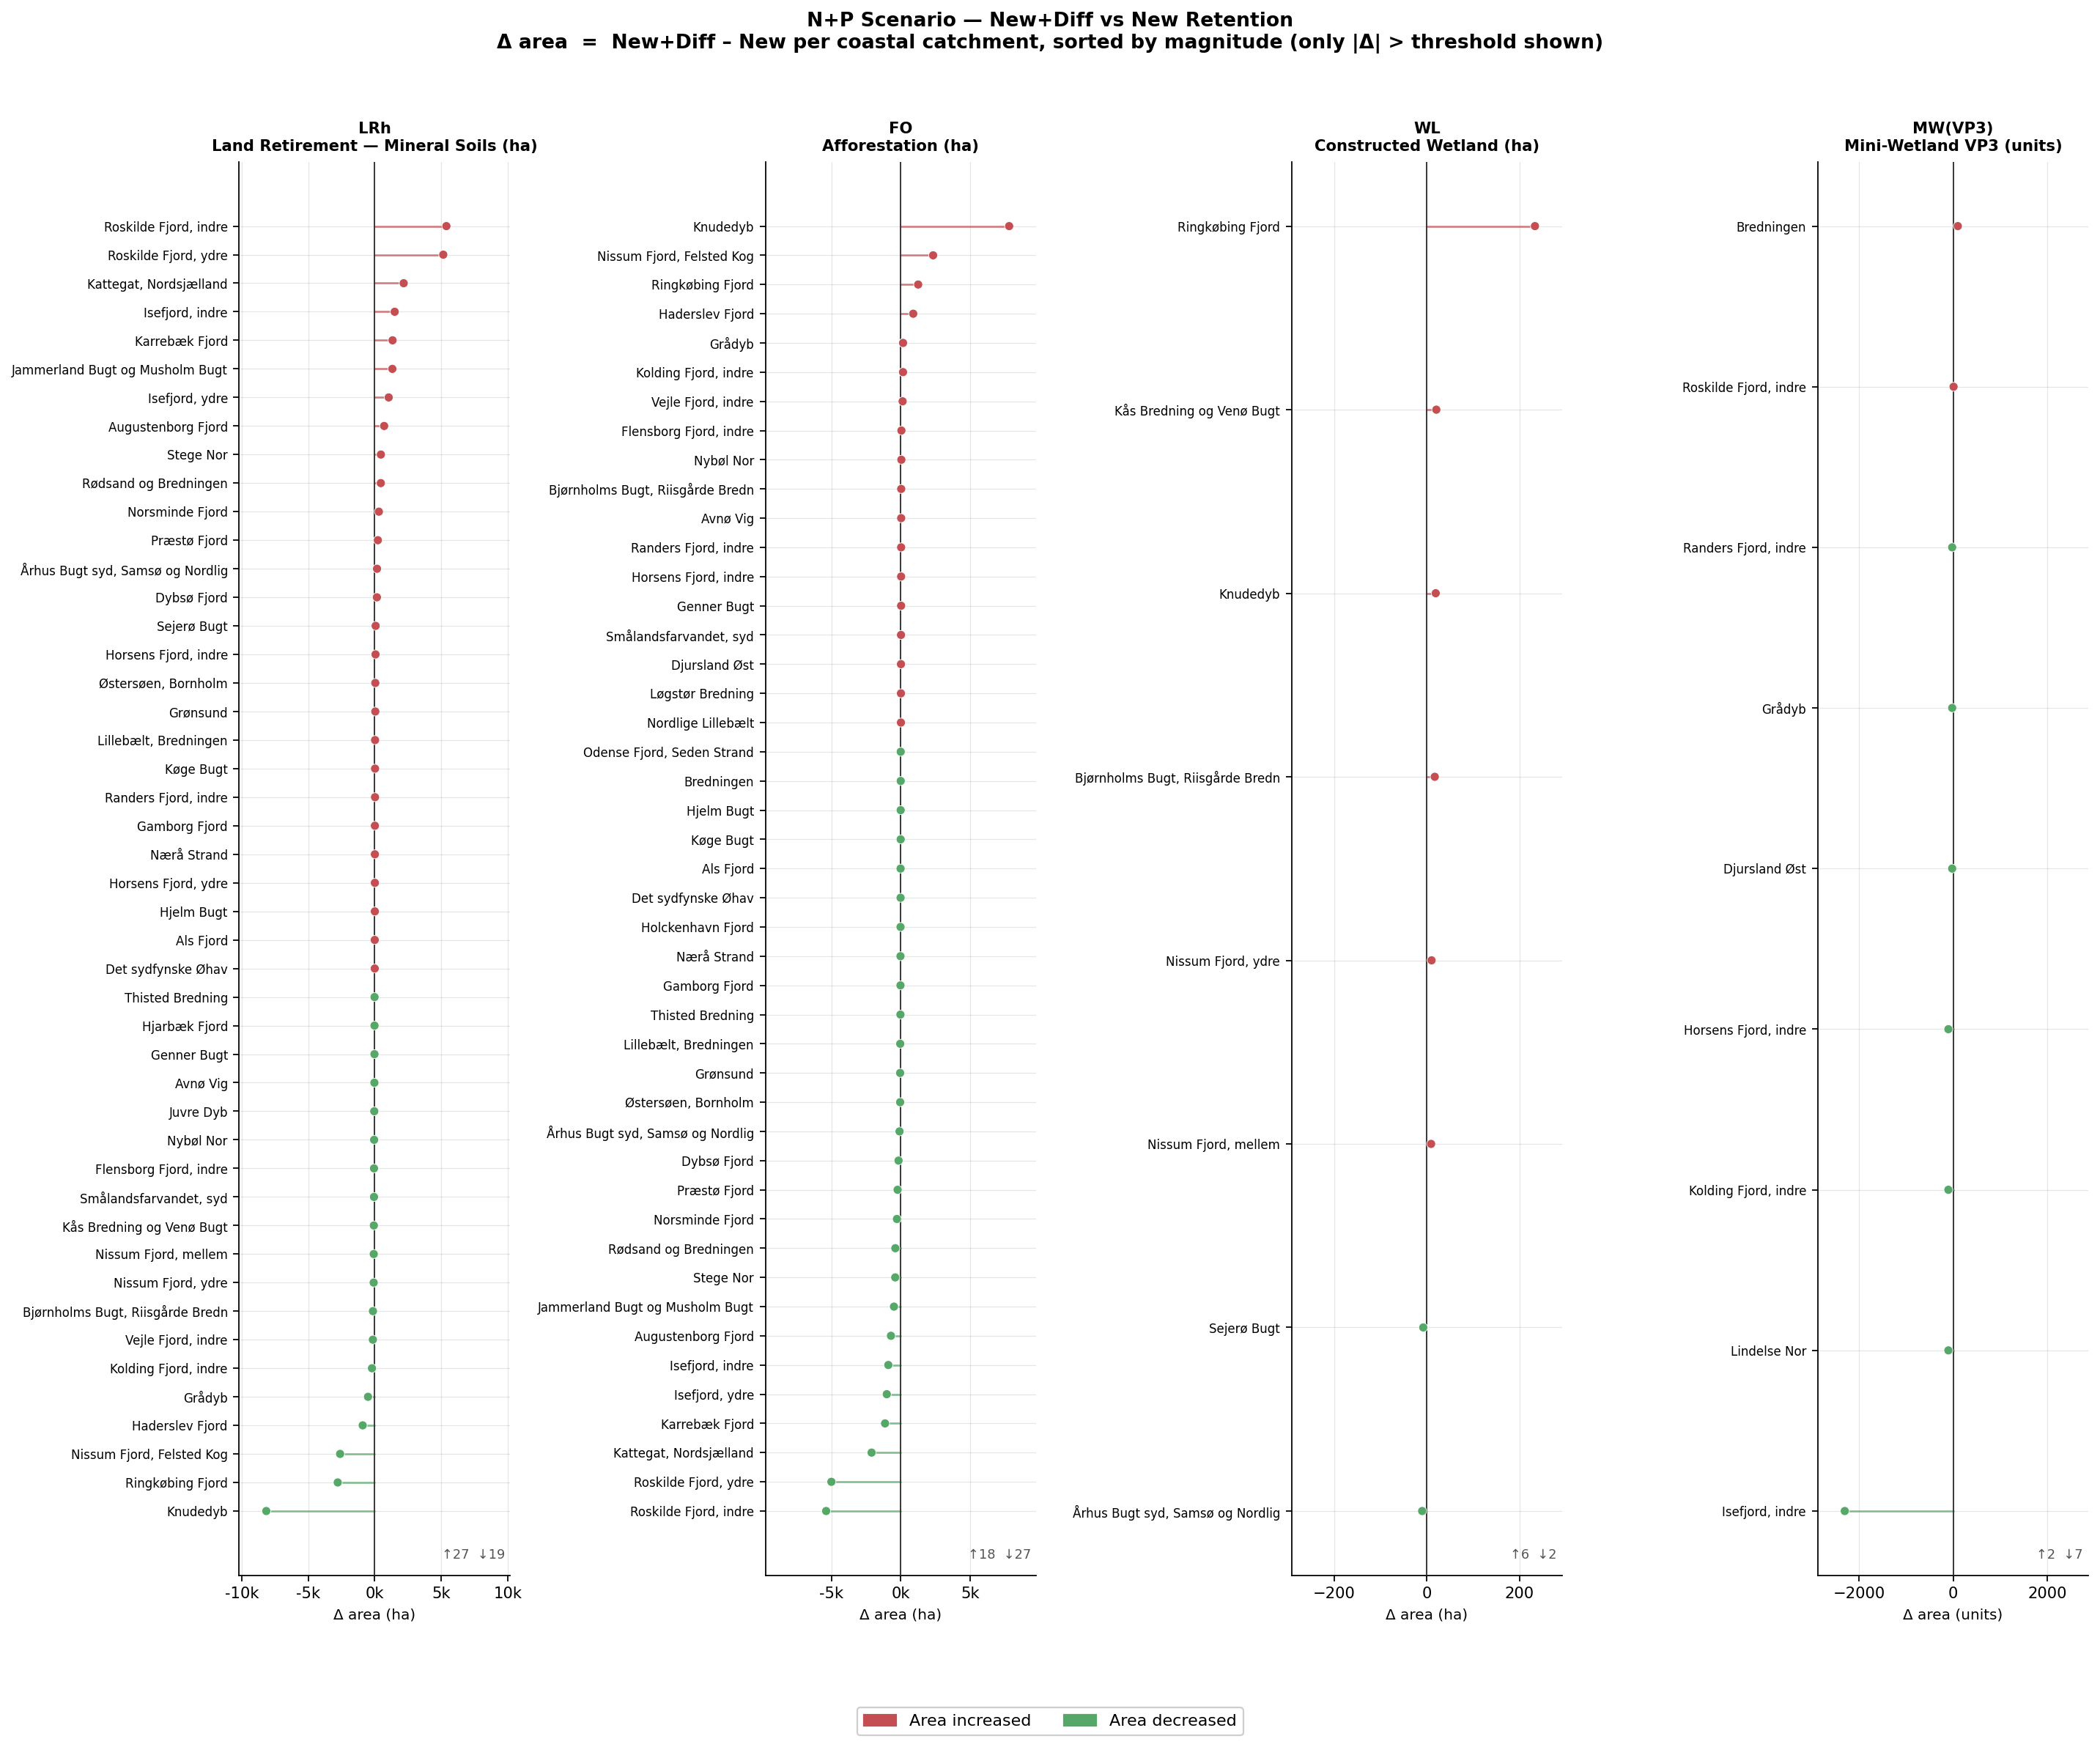
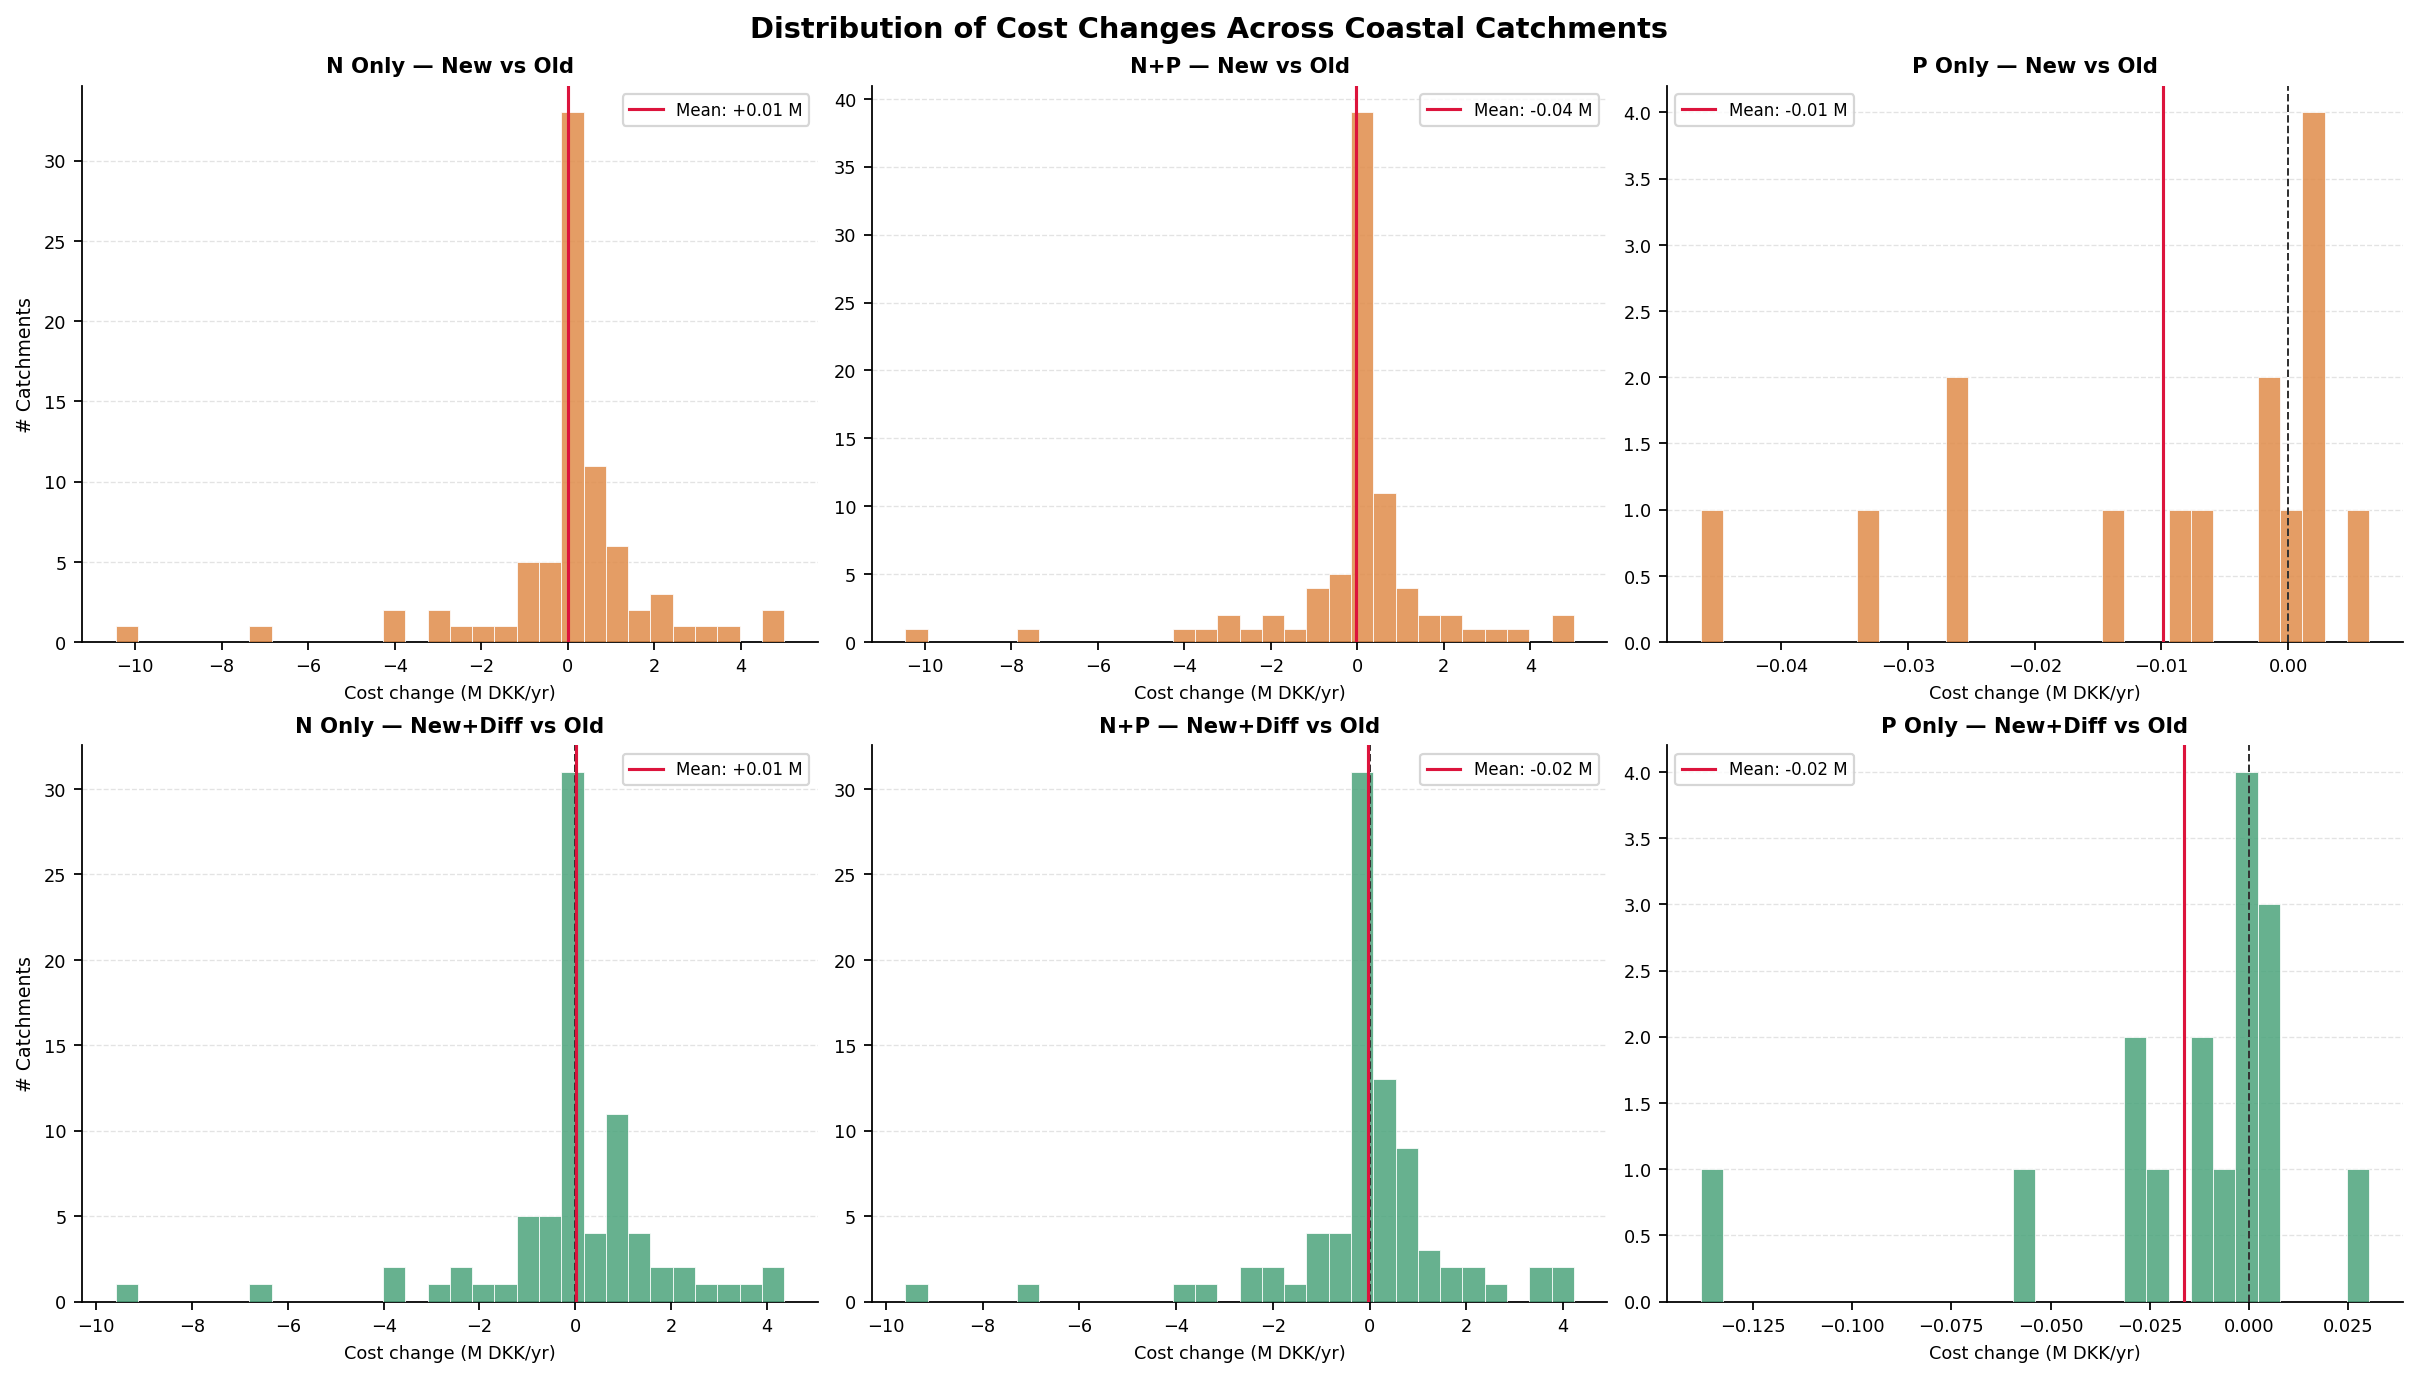
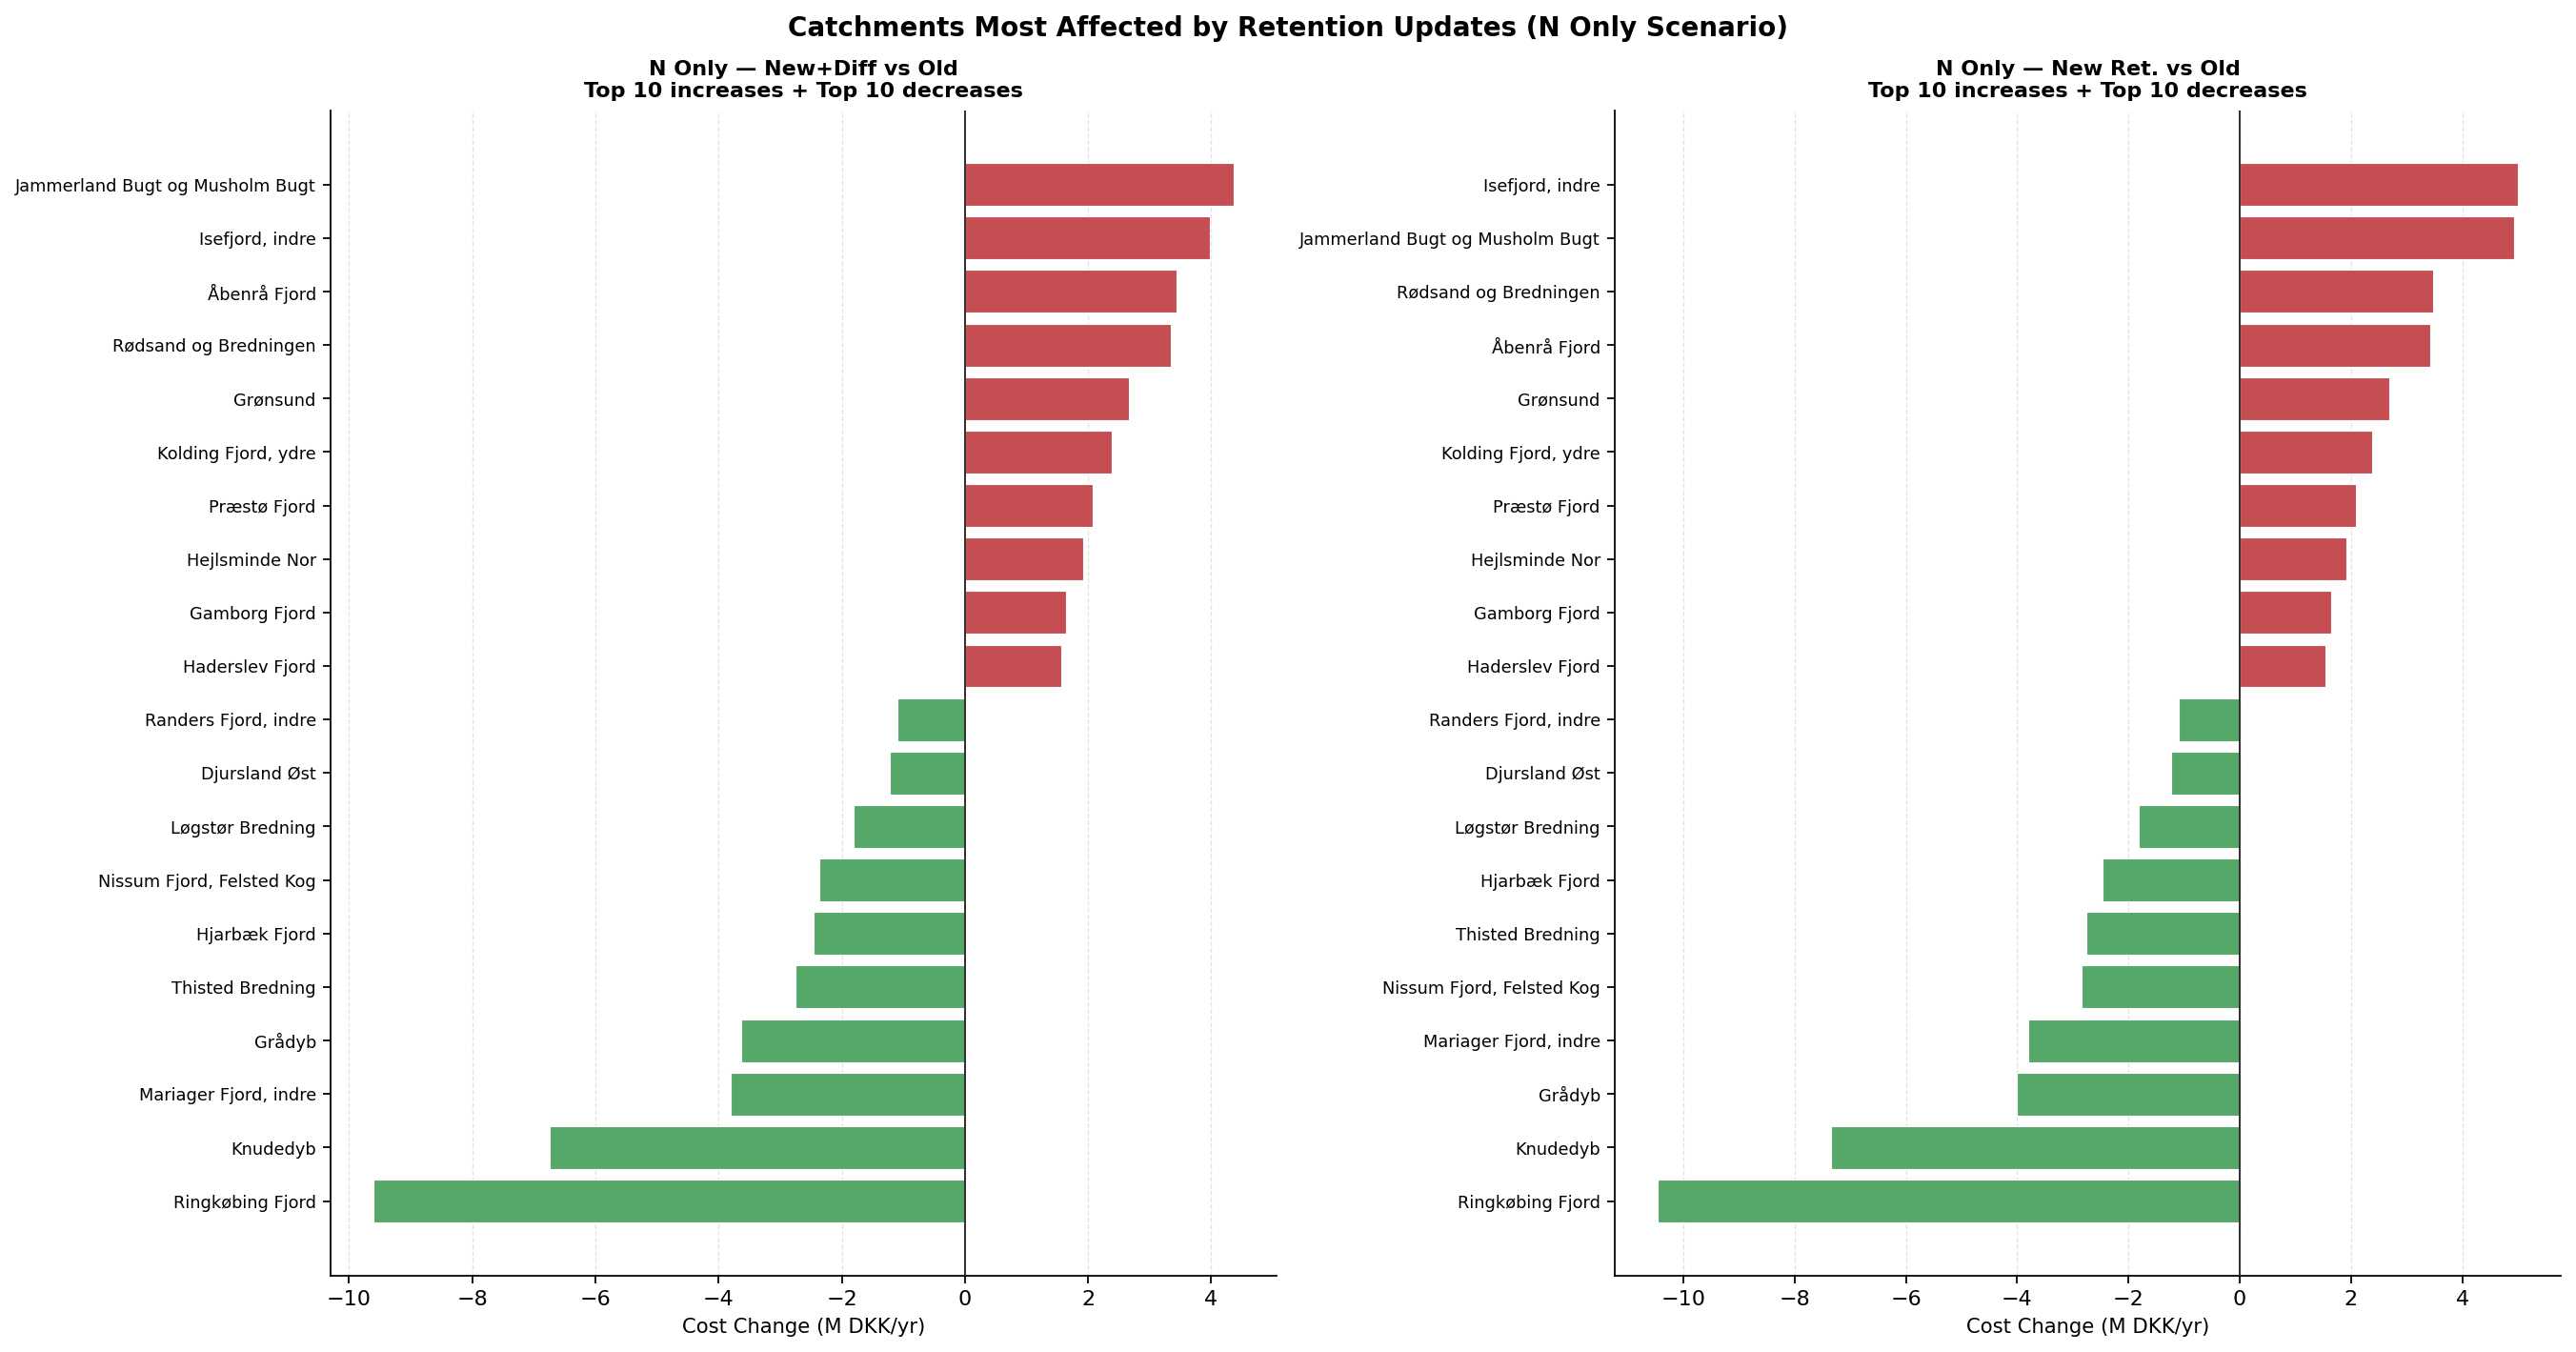
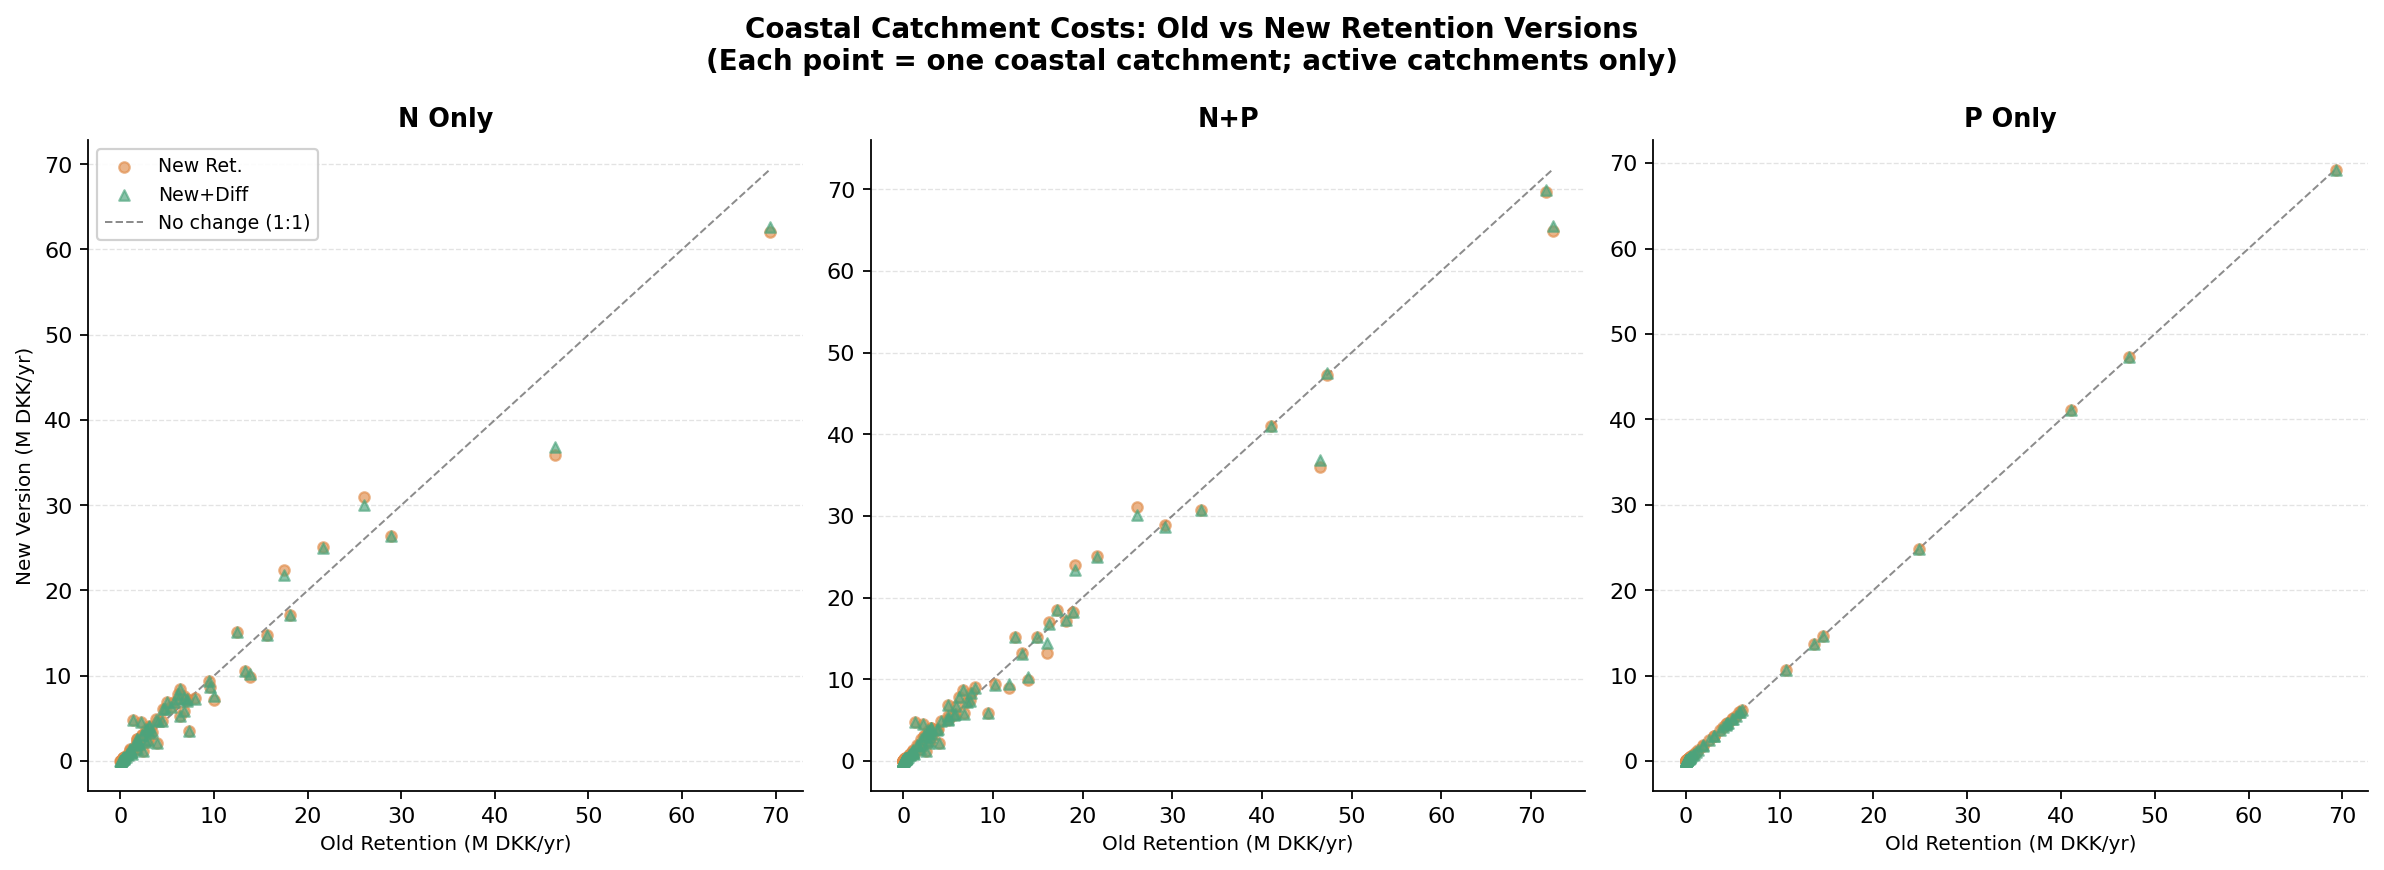
Coastal result hotspots
These summaries are derived from sheet 4. Coastal Catchments in the master comparison workbook.
Largest coastal cost shifts when moving from old to new retention
| Scope | Largest increases | Largest decreases |
|---|---|---|
| N Only | Isefjord, indre +5.00 mDKK, Jammerland Bugt og Musholm Bugt +4.93 mDKK, Rødsand og Bredningen +3.47 mDKK |
Ringkøbing Fjord -10.45 mDKK, Knudedyb -7.34 mDKK, Grådyb -4.01 mDKK |
| N+P | Isefjord, indre +5.01 mDKK, Jammerland Bugt og Musholm Bugt +4.82 mDKK, Rødsand og Bredningen +3.46 mDKK |
Ringkøbing Fjord -10.46 mDKK, Knudedyb -7.50 mDKK, Grådyb -4.00 mDKK |
| P Only | Nakskov Fjord +0.006 mDKK, Kås Bredning og Venø Bugt +0.002 mDKK, Det sydfynske Øhav +0.002 mDKK |
Roskilde Fjord, indre -0.046 mDKK, Lillebælt, Bredningen -0.033 mDKK, Randers Fjord, indre -0.026 mDKK |
Where the differentiation step matters most
- In
N Only, the largest incremental coastal changes from adding differentiation on top of new retention occur atIsefjord, indre(-1.02 mDKK),Ringkøbing Fjord(+0.85 mDKK), andKnudedyb(+0.59 mDKK). - In
N+P, the strongest differentiation response appears atThisted Bredning(+1.26 mDKK),Isefjord, indre(-1.04 mDKK), andRingkøbing Fjord(+0.86 mDKK). - In
P Only, differentiation barely changes coastal costs. The largest absolute effect in the workbook isSmålandsfarvandet, sydat-0.139 mDKK.
Interpretation
- The spatial pattern is highly uneven. A small number of coastal catchments absorb multi-million-DKK shifts when retention assumptions change.
- Those cost shifts occur with almost no visible change in the reported coastal N reductions for the same catchments, which suggests the main effect is portfolio reallocation rather than target failure or large changes in delivered N.
P Onlyis spatially much less sensitive at the coastal-cost level thanN OnlyorN+P.
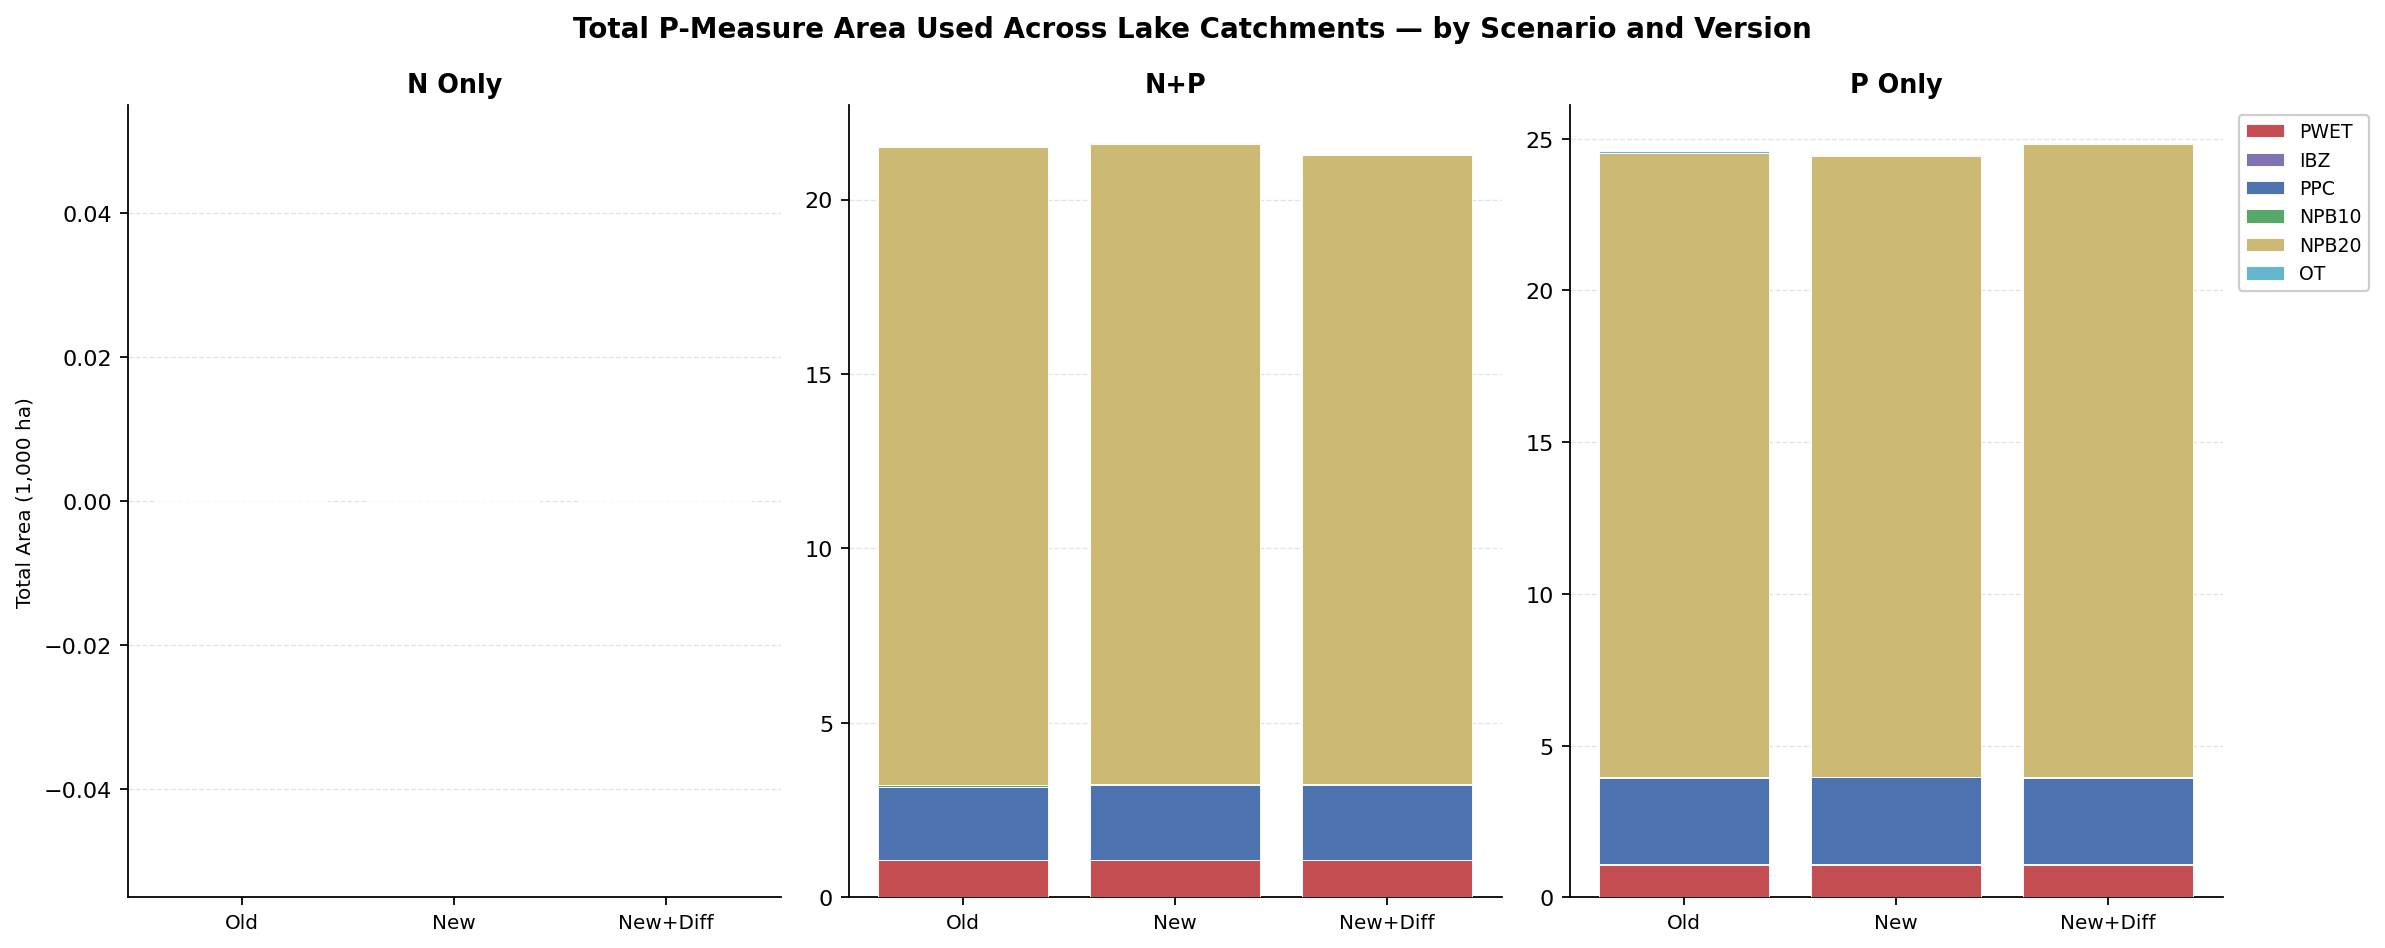
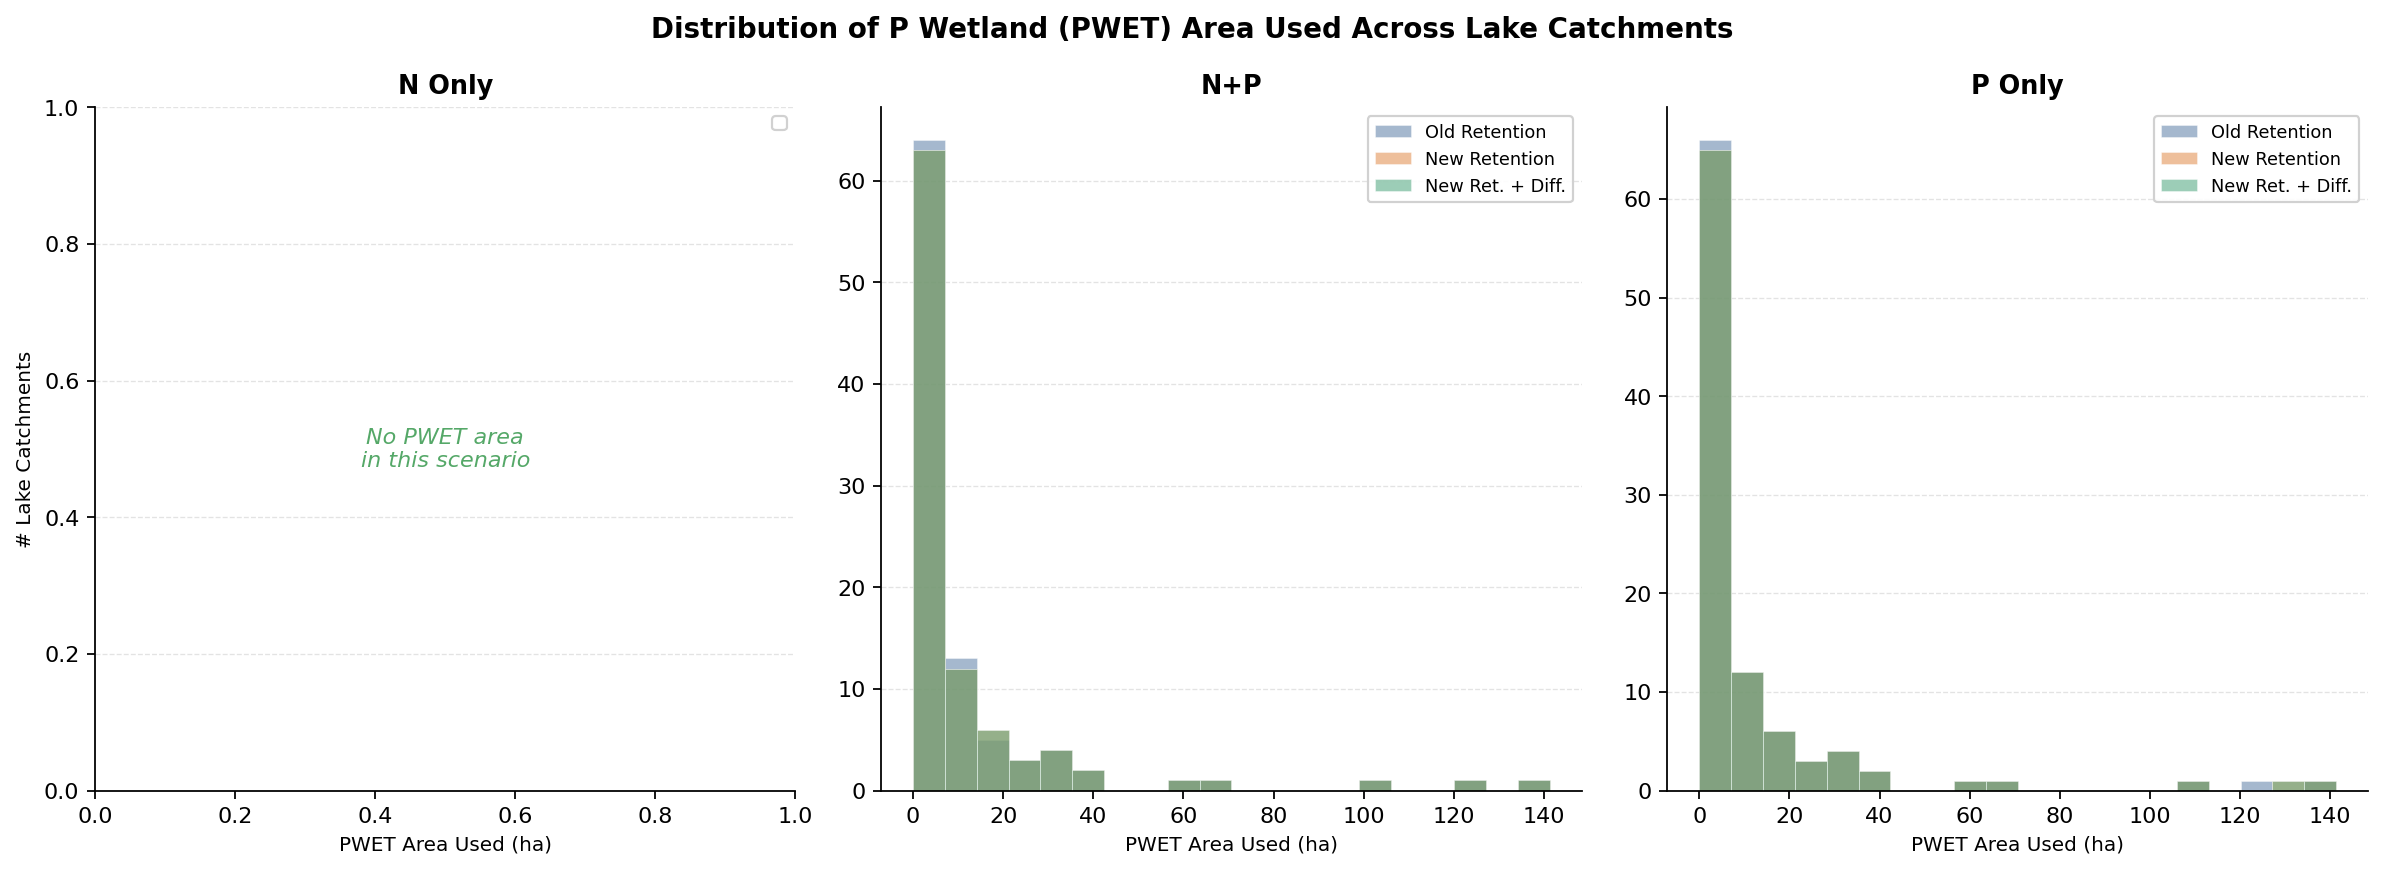
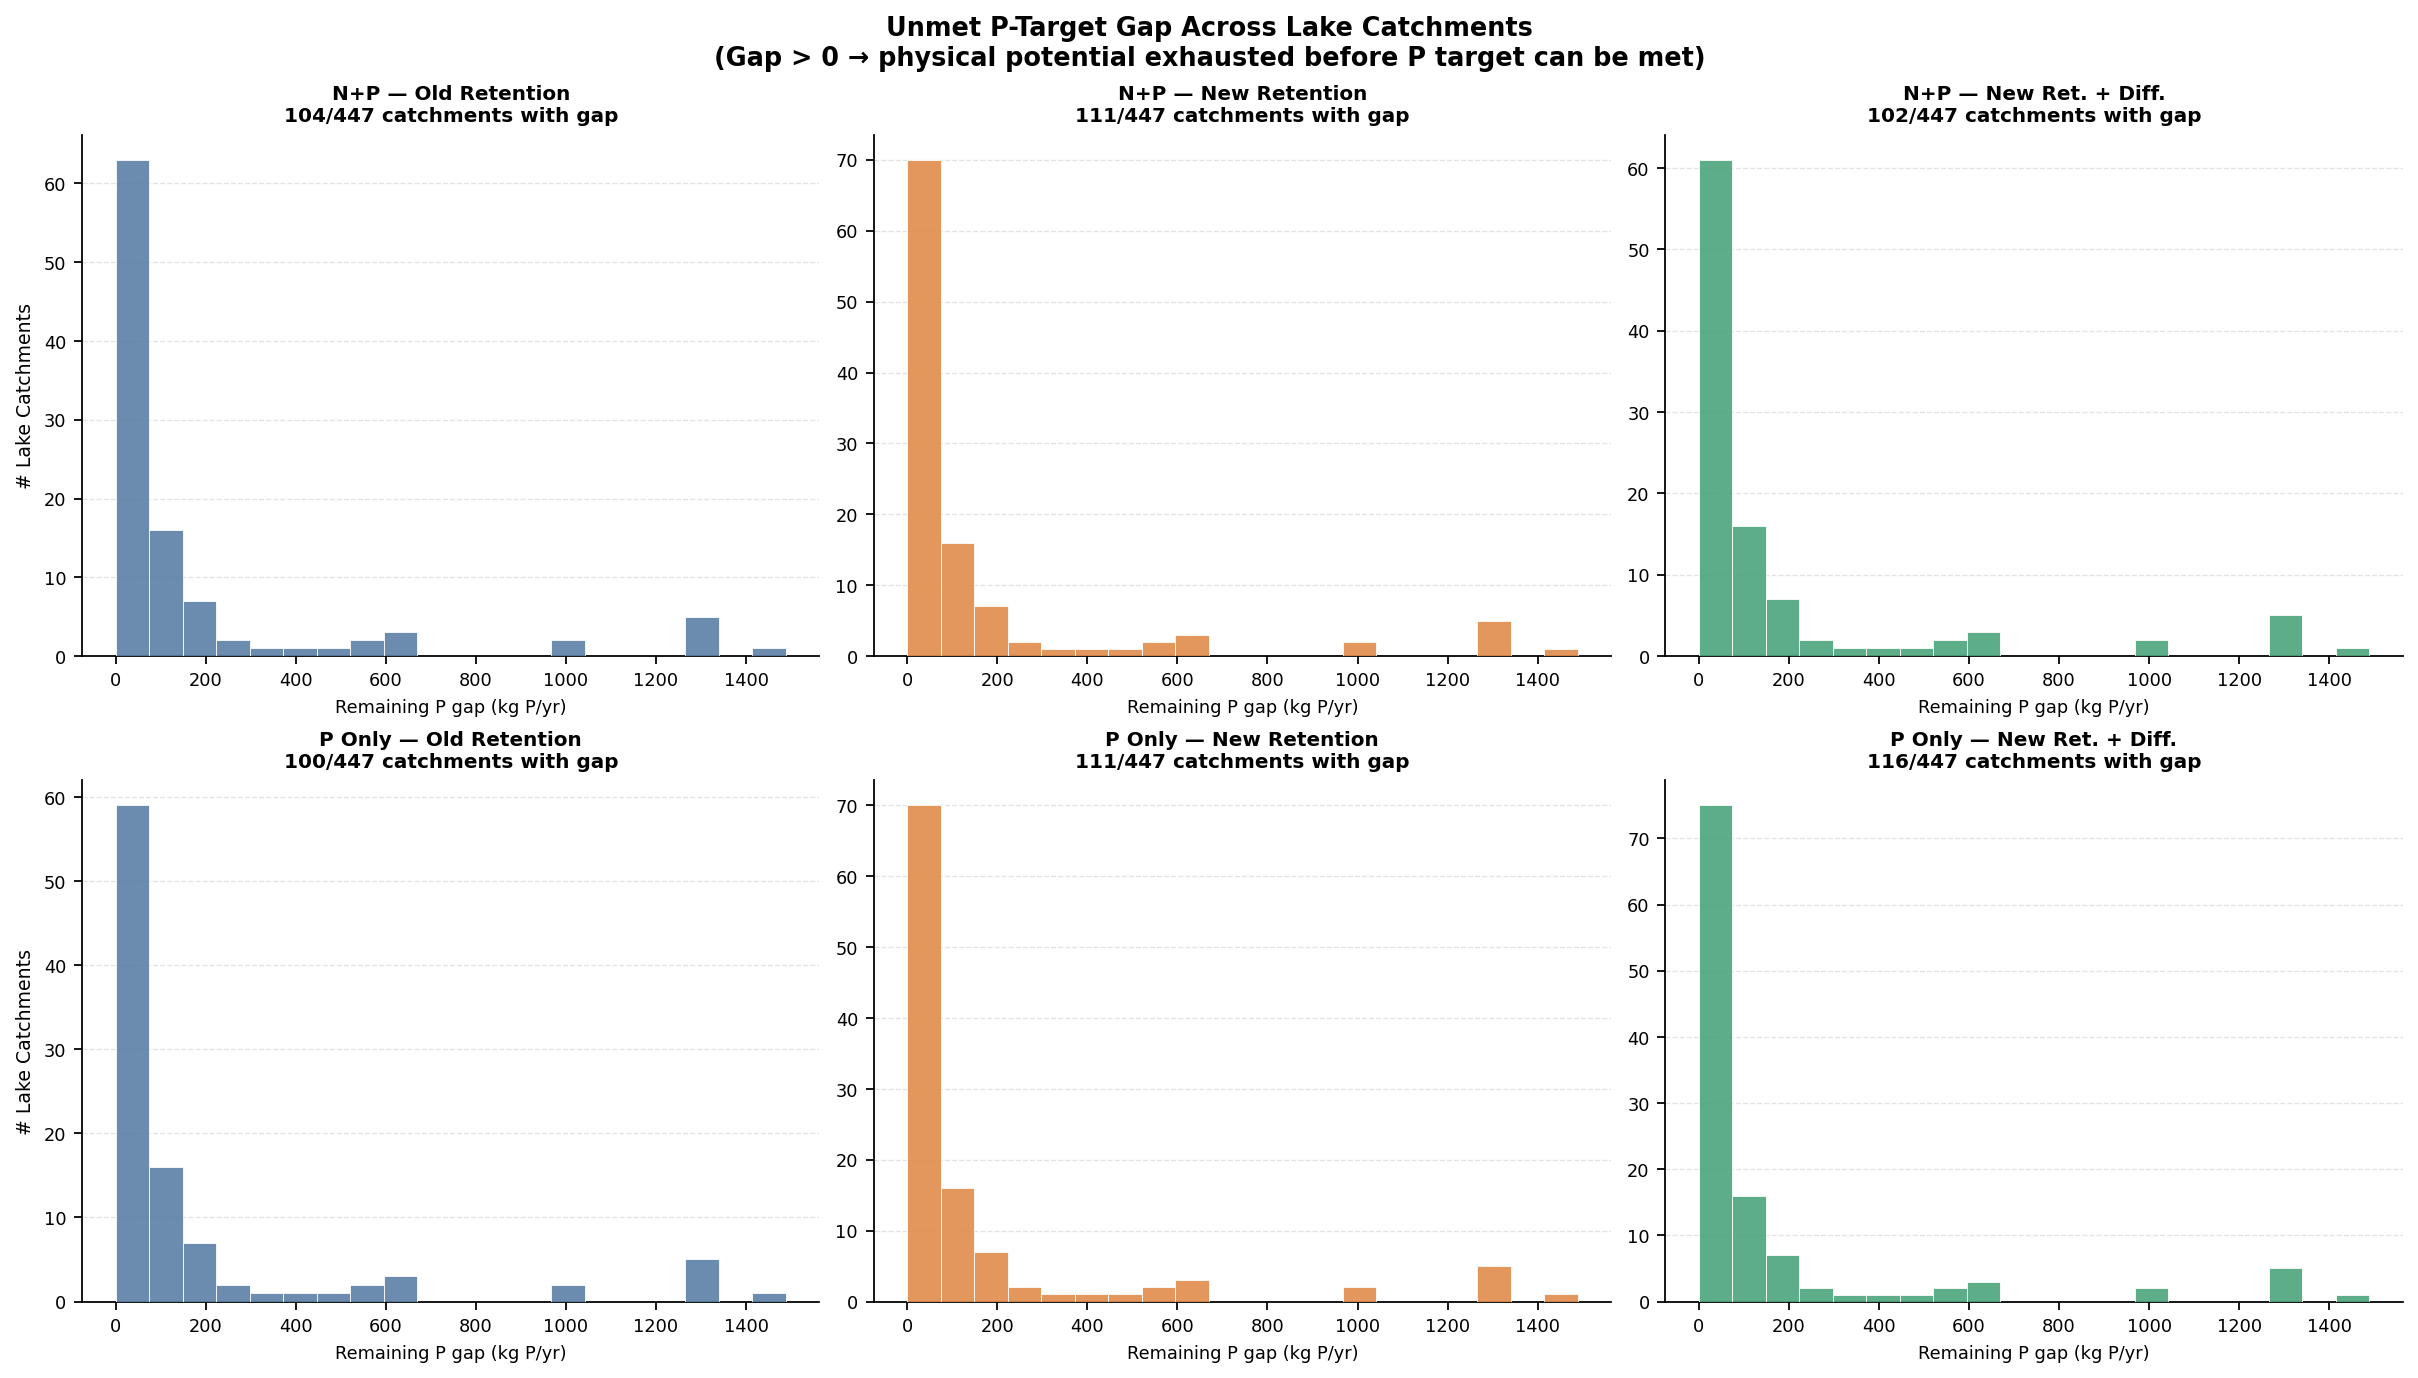
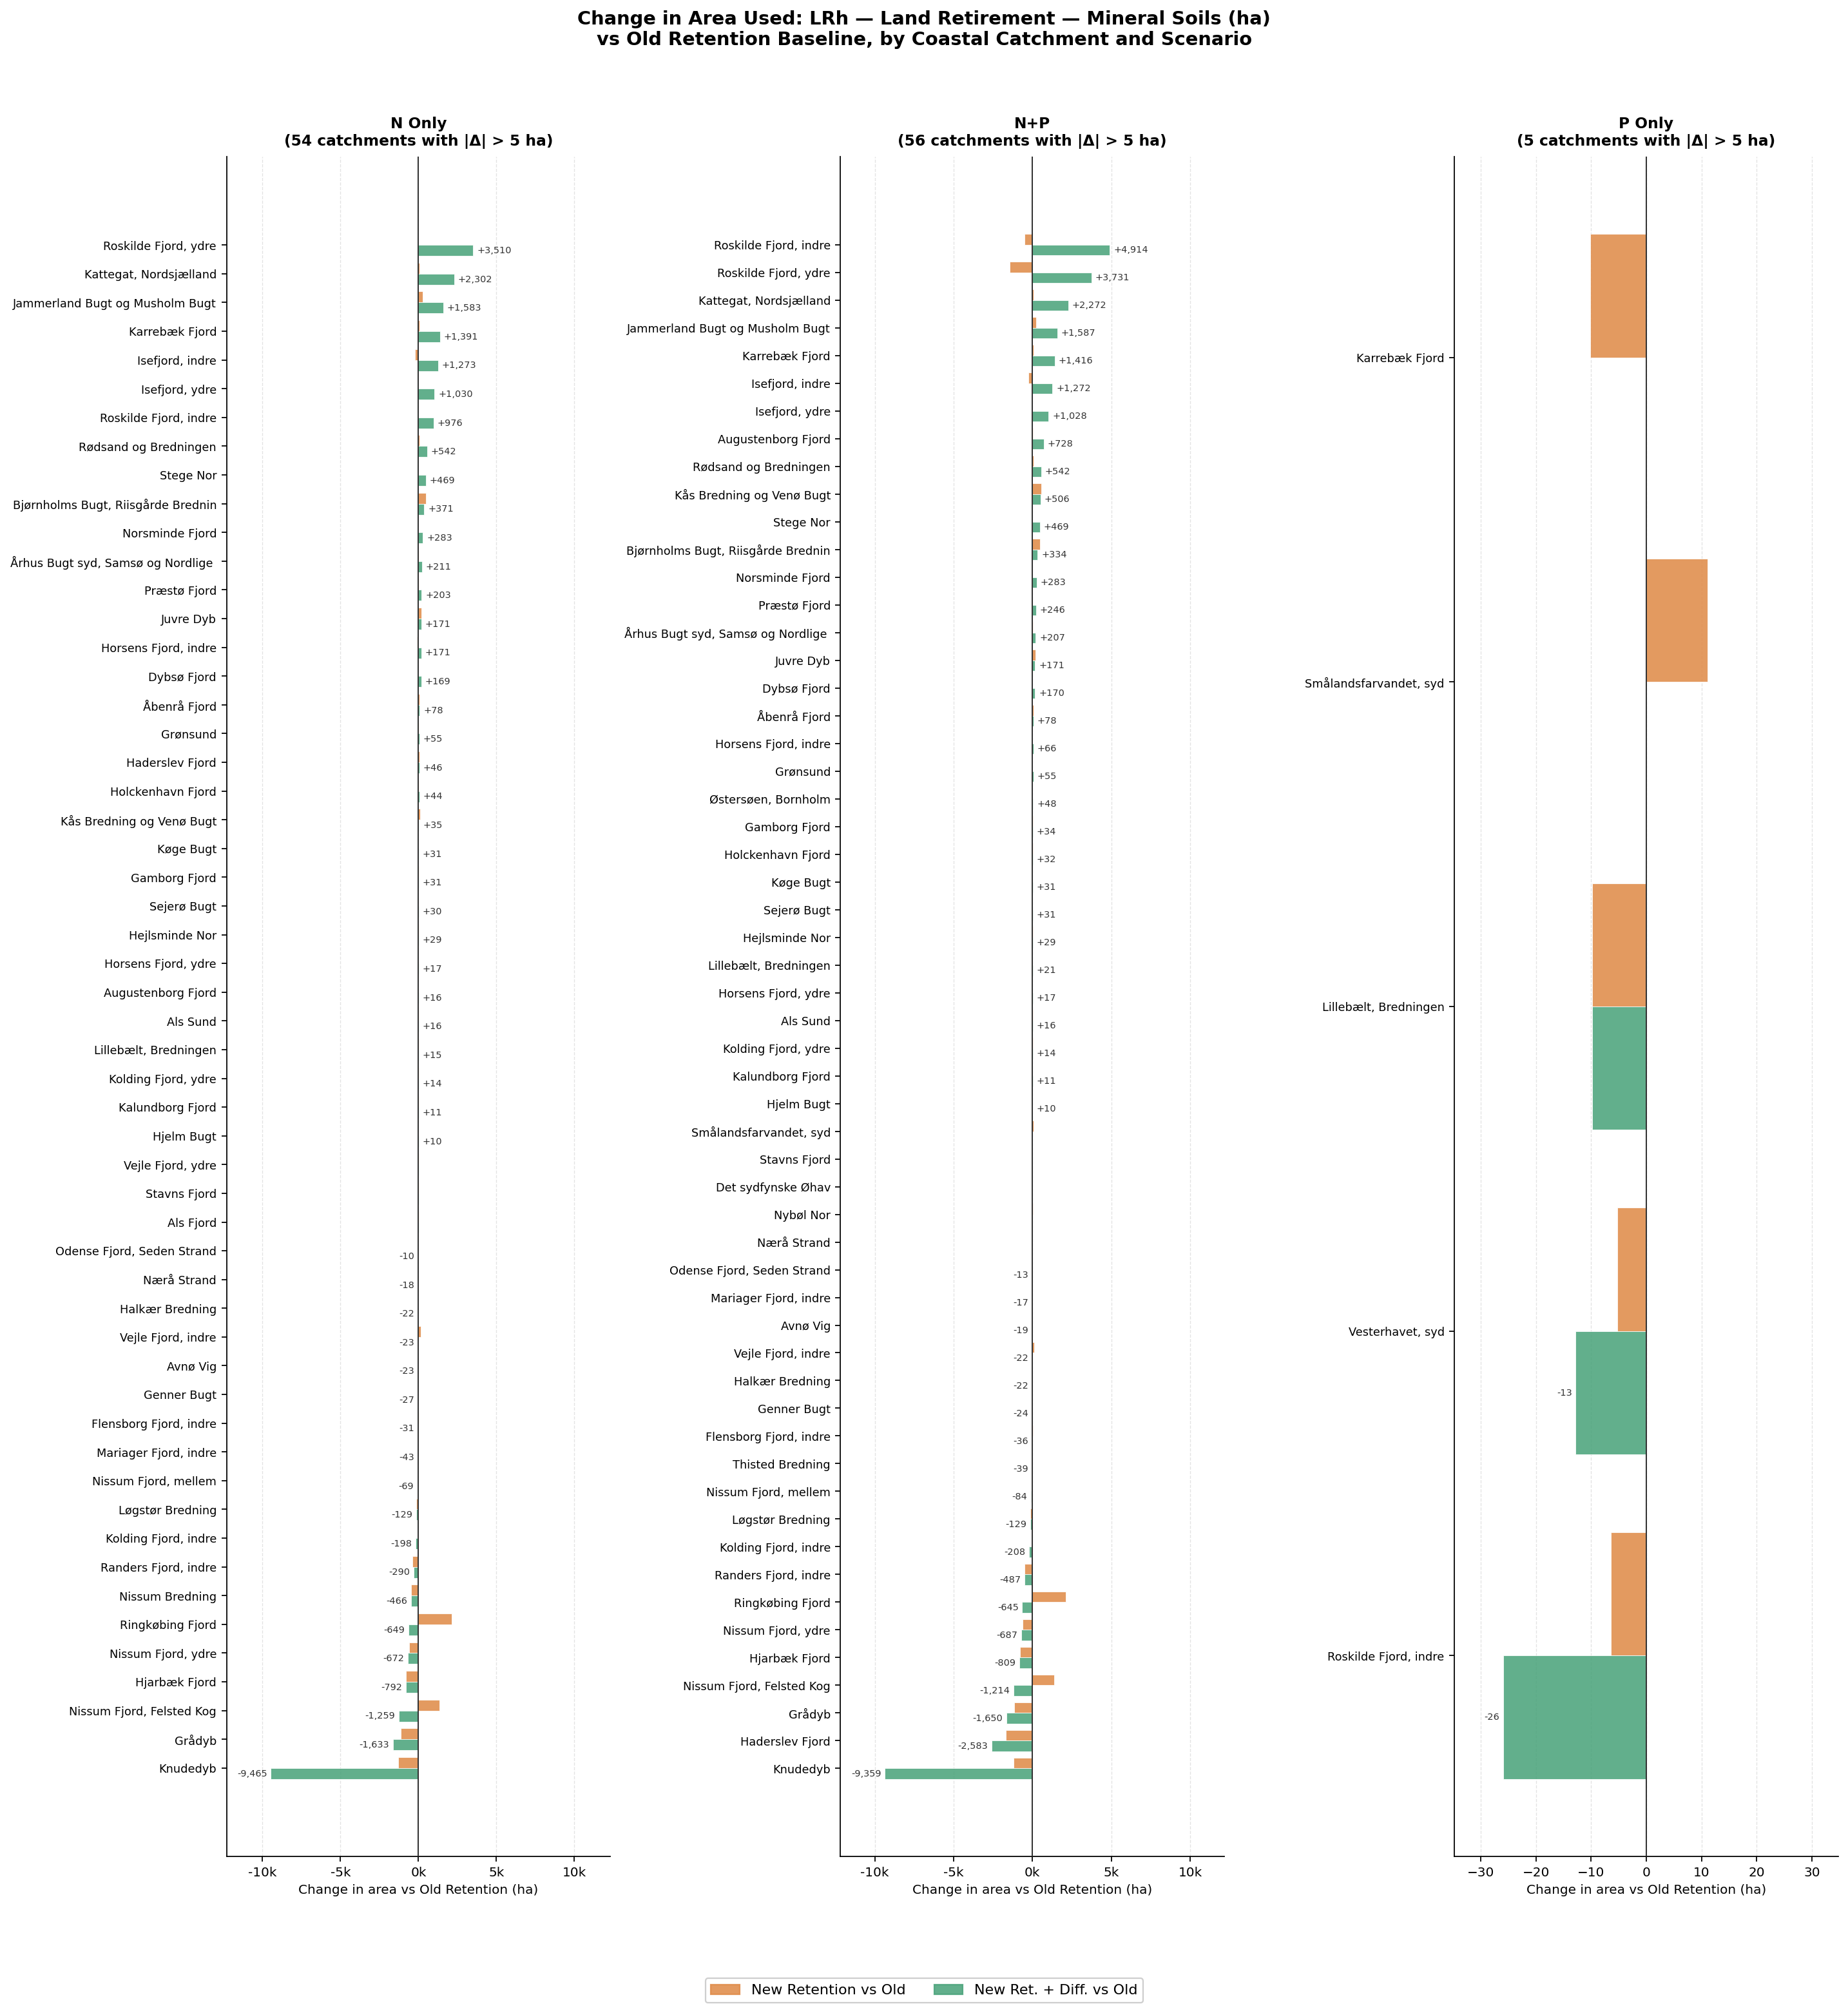
Lake result hotspots
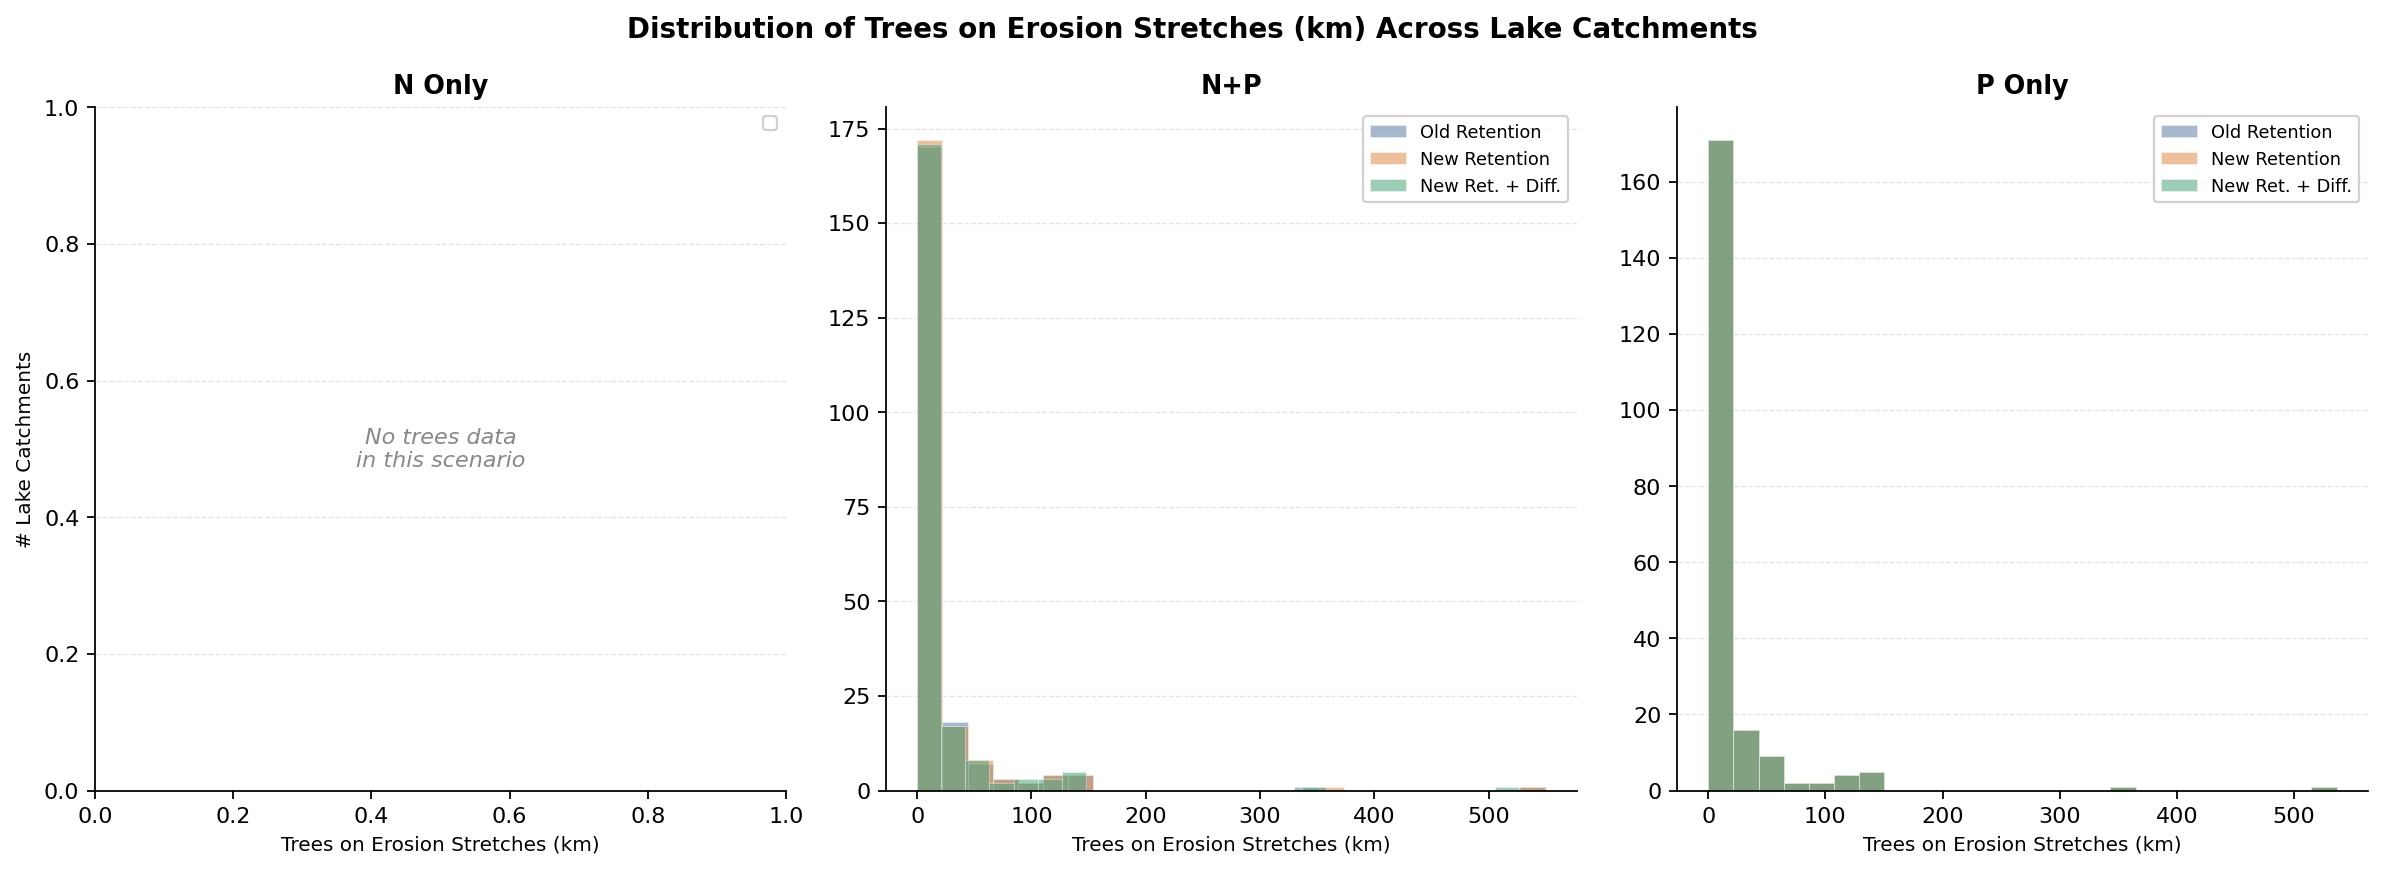
These summaries are derived from sheet 6. Lake - Area by Measure. Units differ by measure: ha for land measures, m for trees, and no. for mini-wetlands.
N+P: largest lake-level reallocations from old to new retention
| Measure | Largest lake-level changes |
|---|---|
| Trees | Tissø +1900 m, Rands Fjord +1900 m, Tystrup Sø +1500 m |
| FO | Arresø +1166 ha, Tange Sø -1014 ha, Glenstrup Sø +1013 ha |
| LRh | Arresø -1152 ha, Hestholm Sø -1144 ha, Stadil Fjord +1067 ha |
| NPB20 | Rands Fjord -248 ha, Jels Oversø +218 ha, Vejlen +204 ha |
| MW(VP3) | Kær Vig +250, Torbenfeld Sø +50, Rugård Søndersø -30 |
P Only: largest lake-level reallocations from old to new retention
| Measure | Largest lake-level changes |
|---|---|
| Trees | Rands Fjord -2700 m, Nakskov Indrefjord +2100 m, Nordby Sø -600 m |
| NPB20 | Rands Fjord +111.7 ha, Skanderborg Sø -42.5 ha, Søgård Sø v. Herlufmagle -37.4 ha |
| PPC | Stilling-Solbjerg Sø +20.46 ha, Jølby Nor -15.36 ha, Hejlskov Sø +8.32 ha |
| FO / LRh swap | Sø v. Keldernæs FO -11.12 ha and LRh +11.12 ha; Flægen v. Eskør Inddæmning FO -8.52 ha and LRh -9.80 ha |
| MW(VP3) | Kornerup Sø -30, Østerild Fjord -20, Bryrup Langsø -20 |
Interpretation
- The lake-side response is more reallocation-heavy than the national totals suggest. Large local swings can hide behind small national cost changes.
- In
N+P, the strongest shifts involveFO,LRh, tree measures, and selectedNPB20reallocations. - In
P Only, some lake catchments show strong substitution between lake-relevant measures even though total national cost barely moves.
Figures
National comparisons
Total cost — National cost comparison by target scope and model version.
Differentiation effect — Visual summary of the incremental effect of adding differentiation.
Total area — Total selected area or units by target scope and version.
Comparison graphics
New vs Old — Lollipop comparison of N and P outcomes after the retention update.
Diff vs New — Lollipop comparison of N and P outcomes after adding differentiation.
Spatial diagnostics
Coastal cost distribution — Spatial distribution of coastal costs across catchments.
Catchment cost changes — Where costs rise and fall under the updated assumptions.
Lake P area by measure — Lake-level allocation of P-relevant measures.
Lake trees distribution — Spatial distribution of tree allocations in the lake-focused results.
Additional figures
Cost change vs old
Cost by group
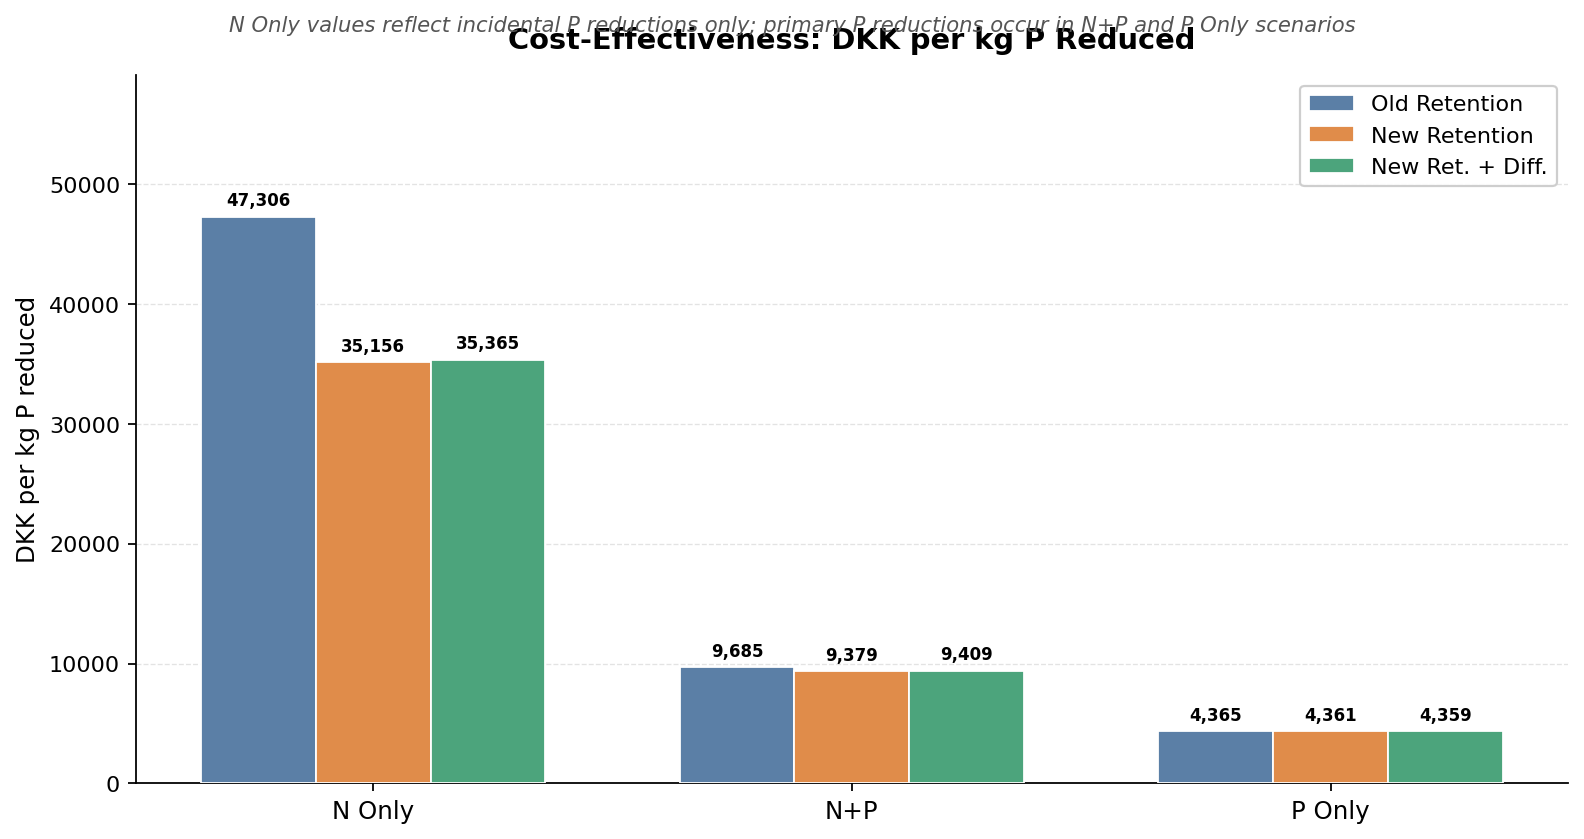
Cost per kg P
Cost per kg N
Measure costs
Coastal scatter
Coastal N reduction scatter

Lake PWET distribution
P gap distribution
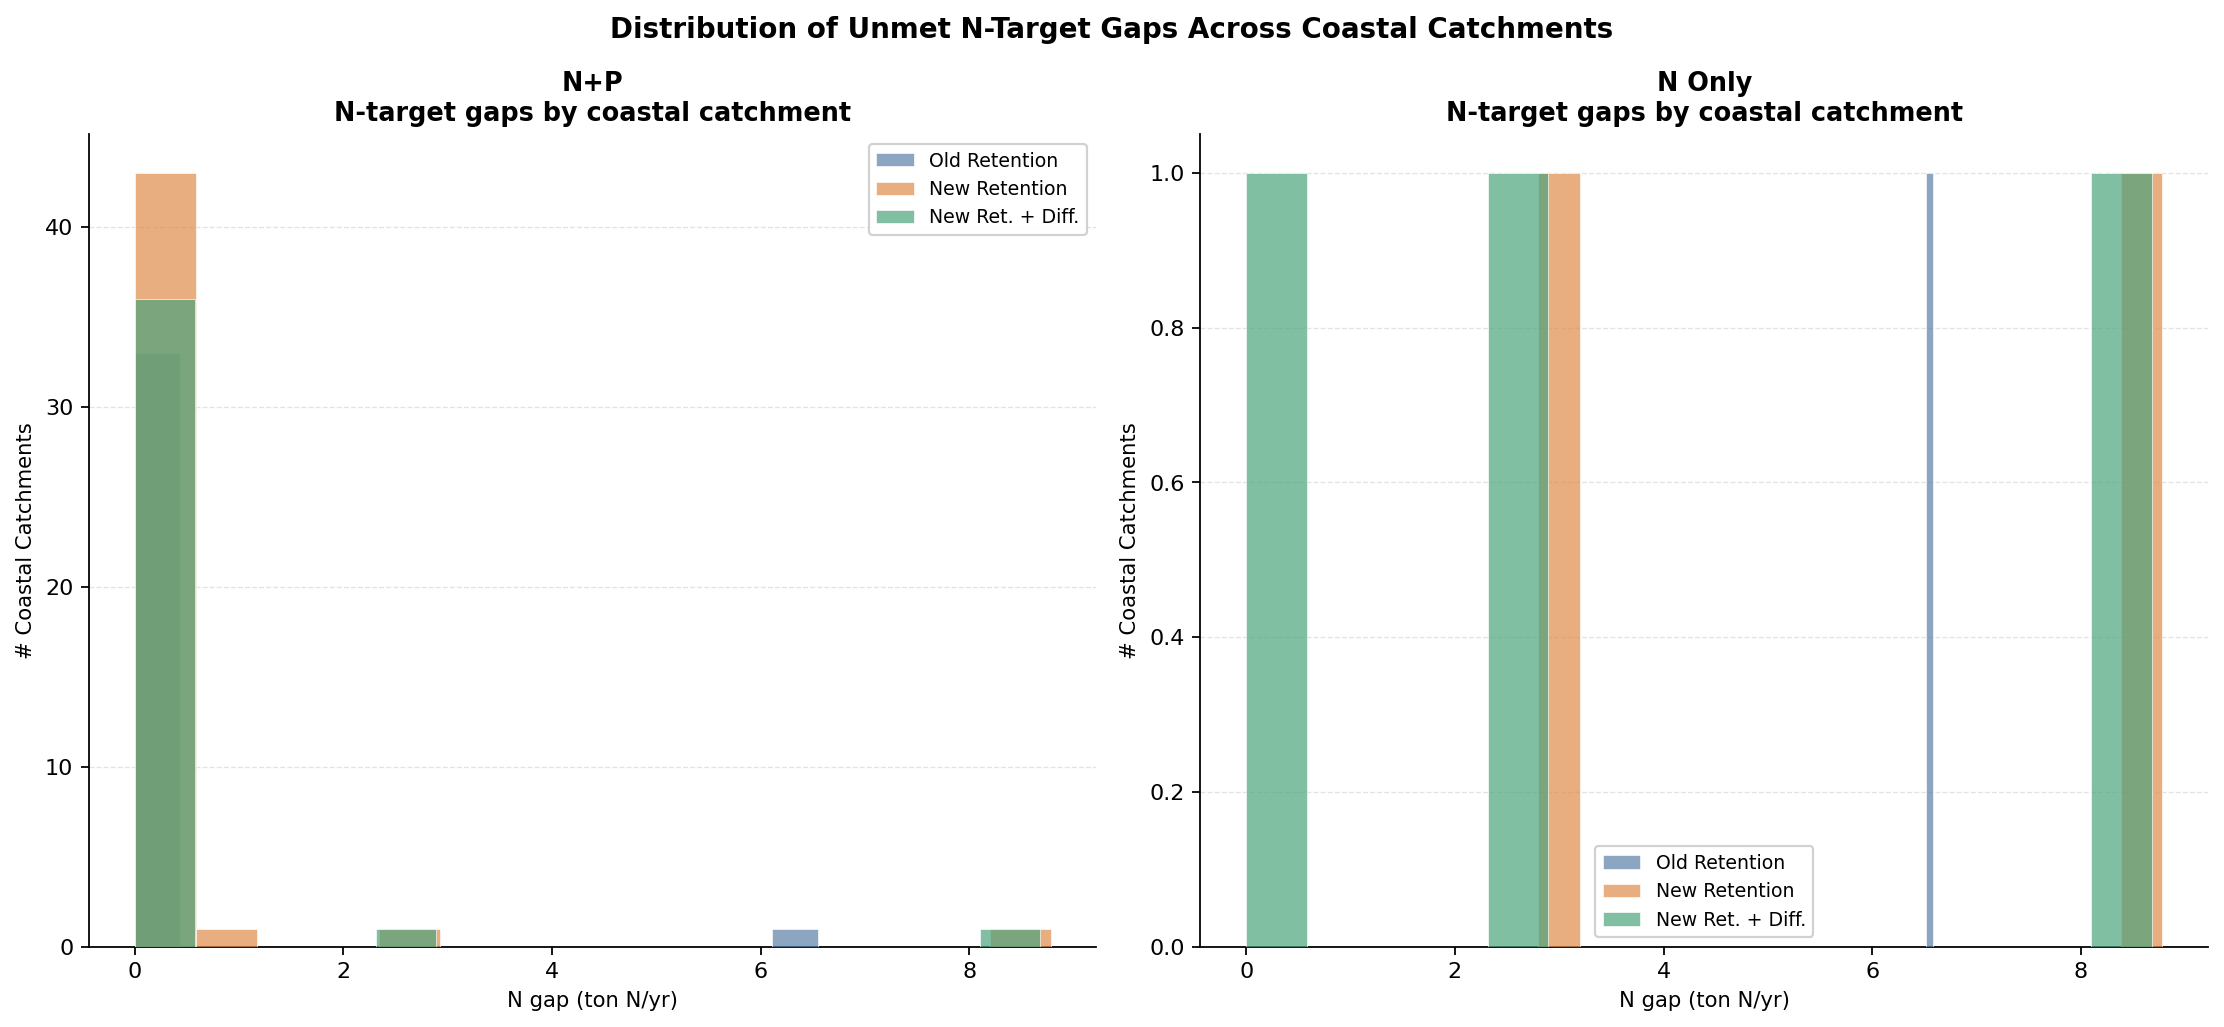
N gap distribution
Area change — LRh
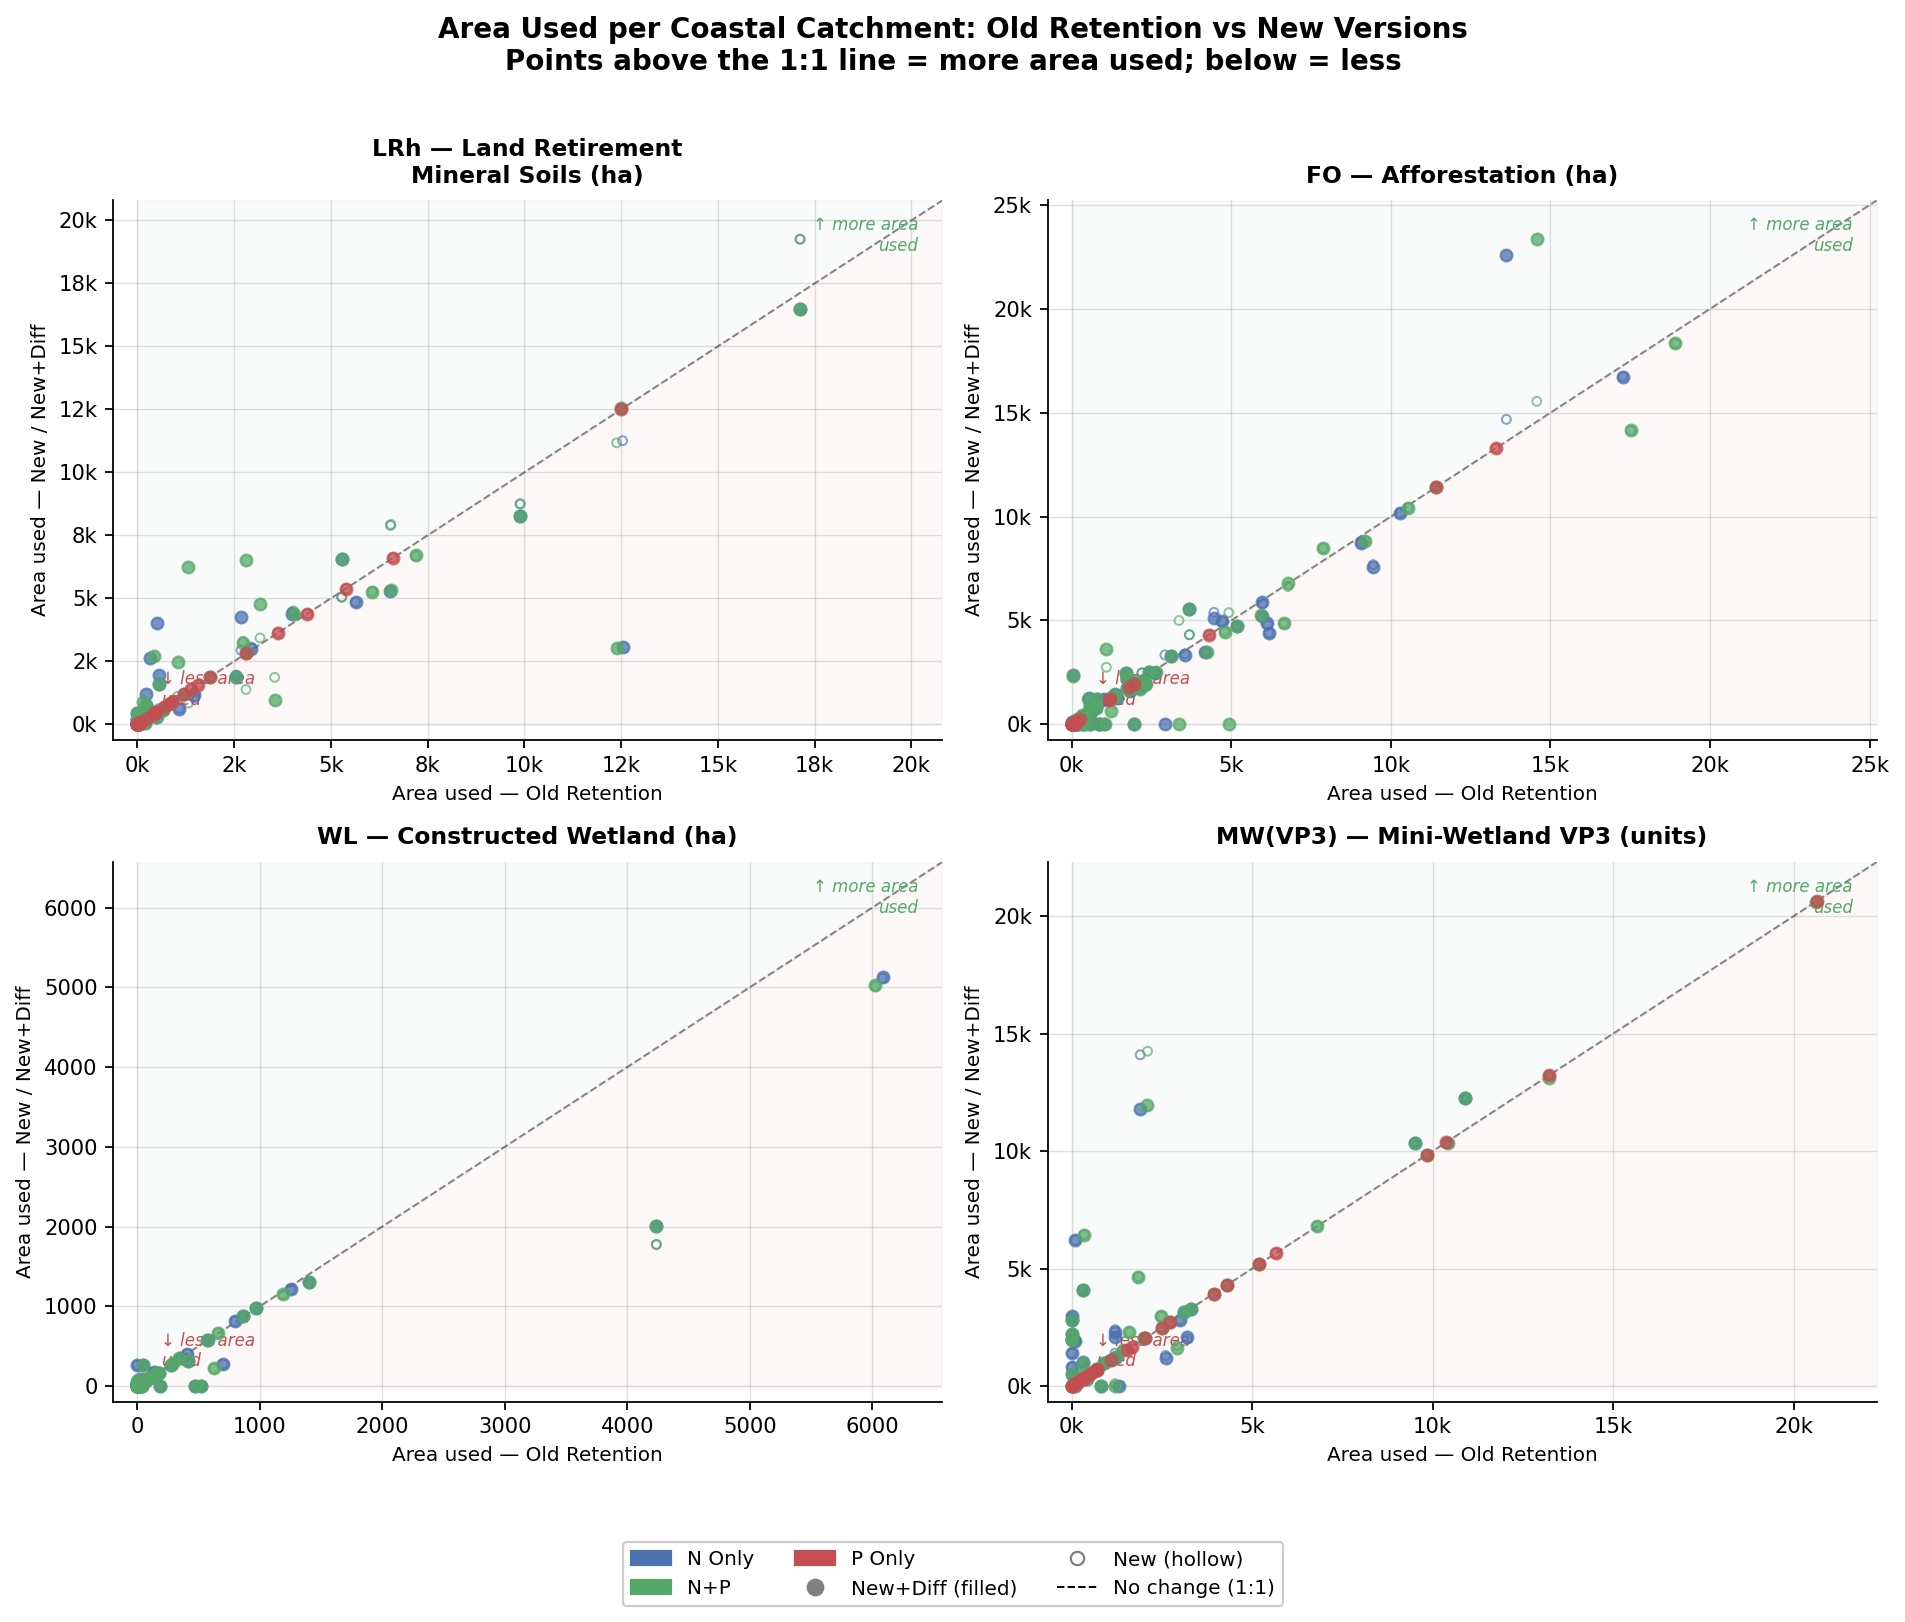
Area scatter
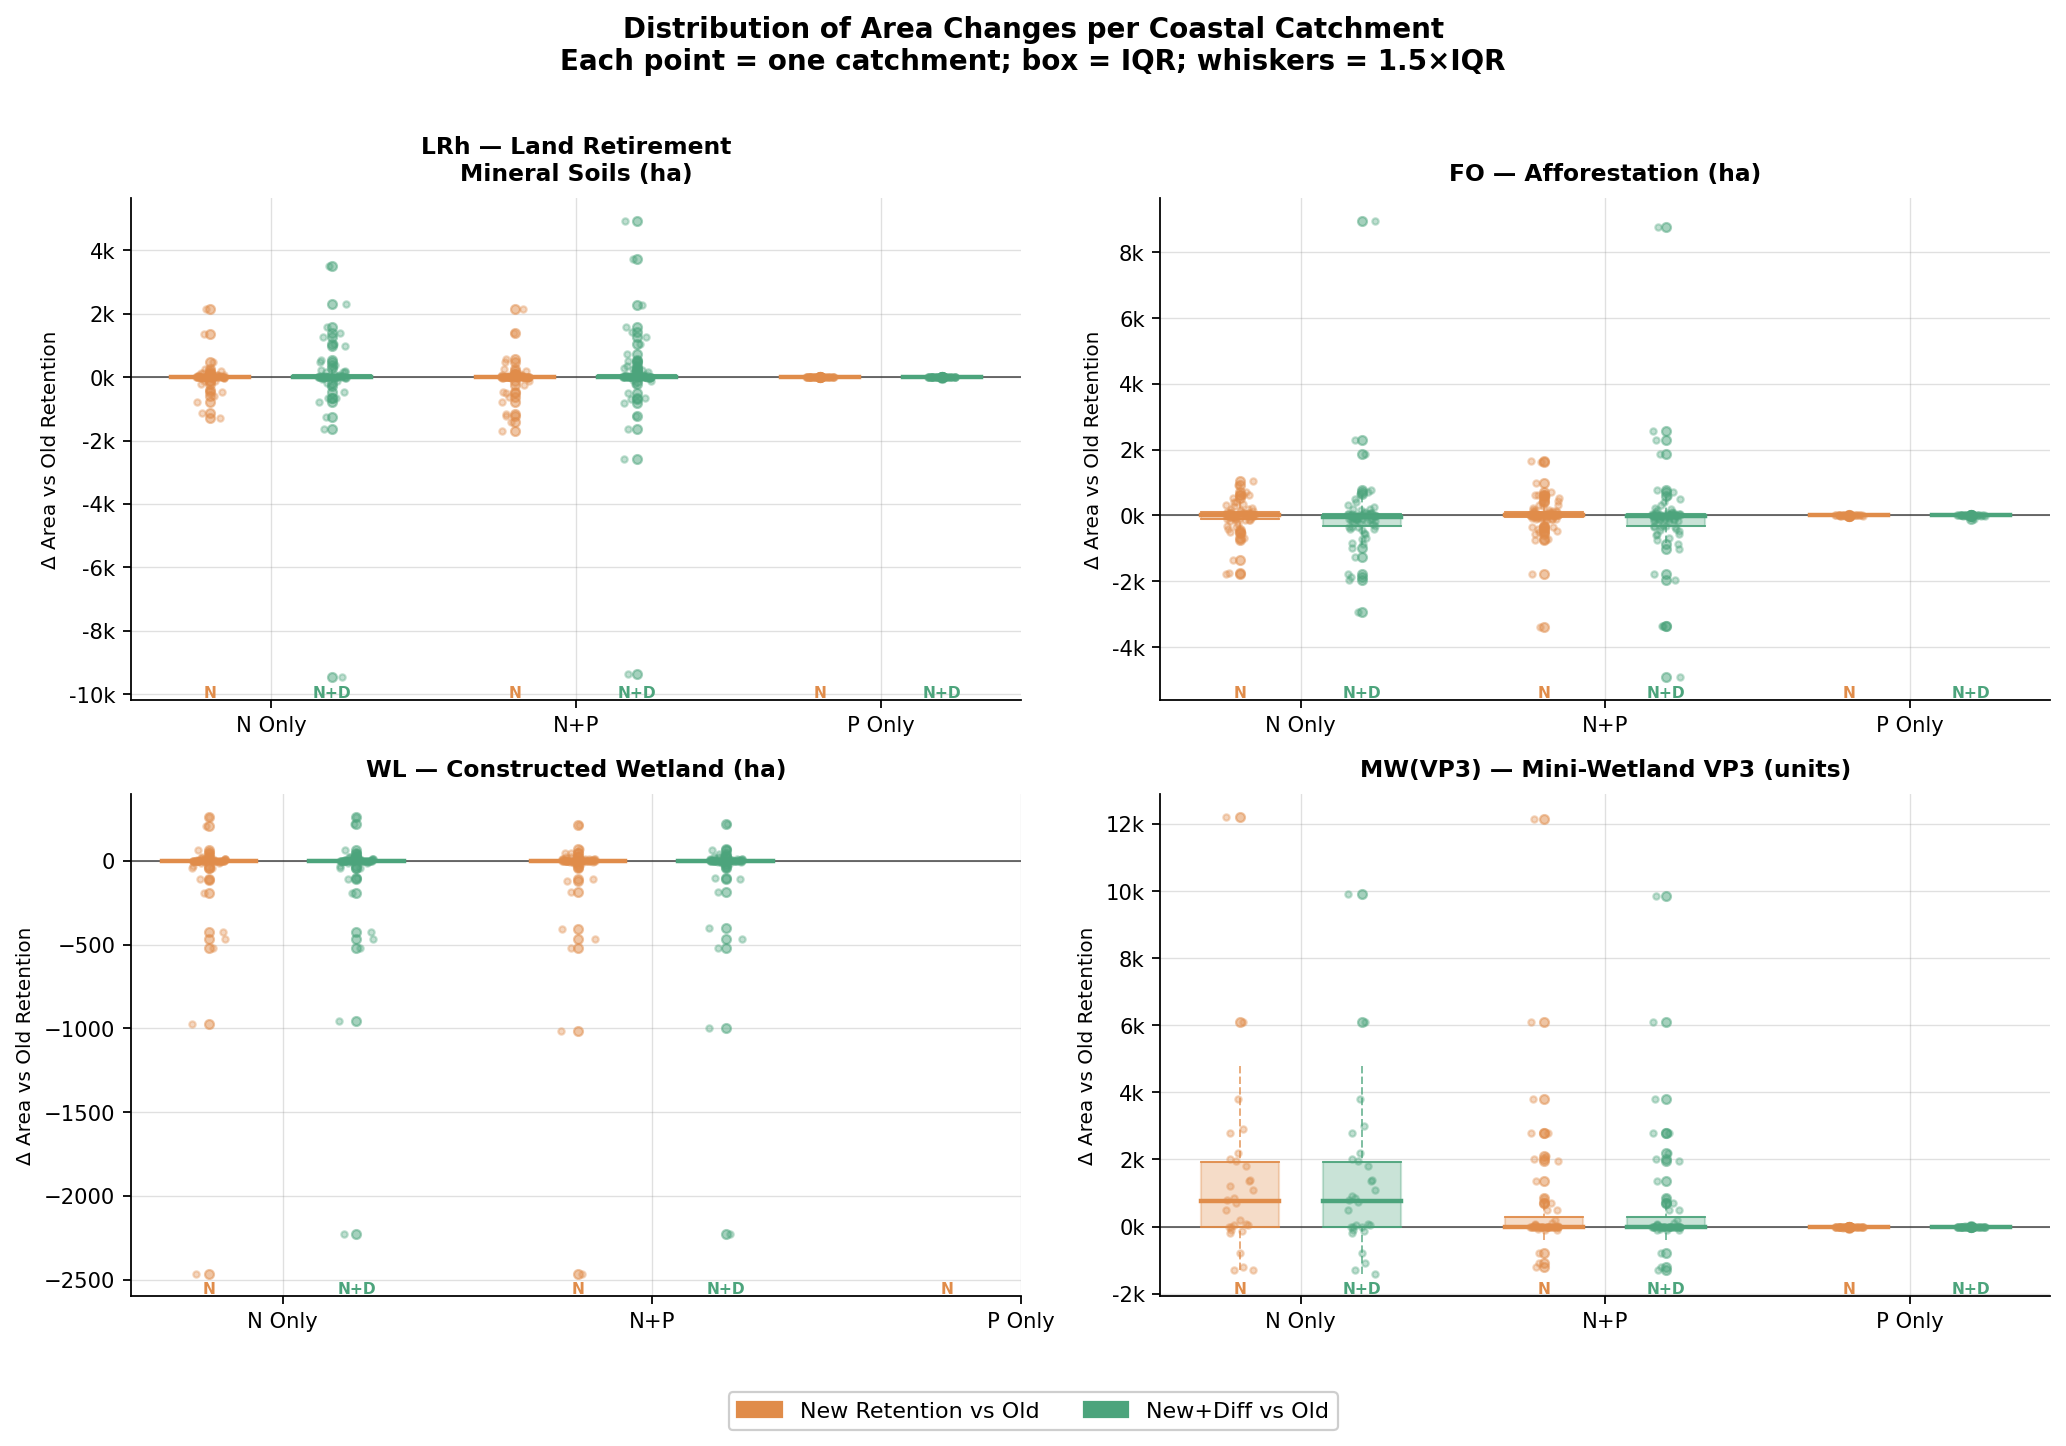
Area boxplot
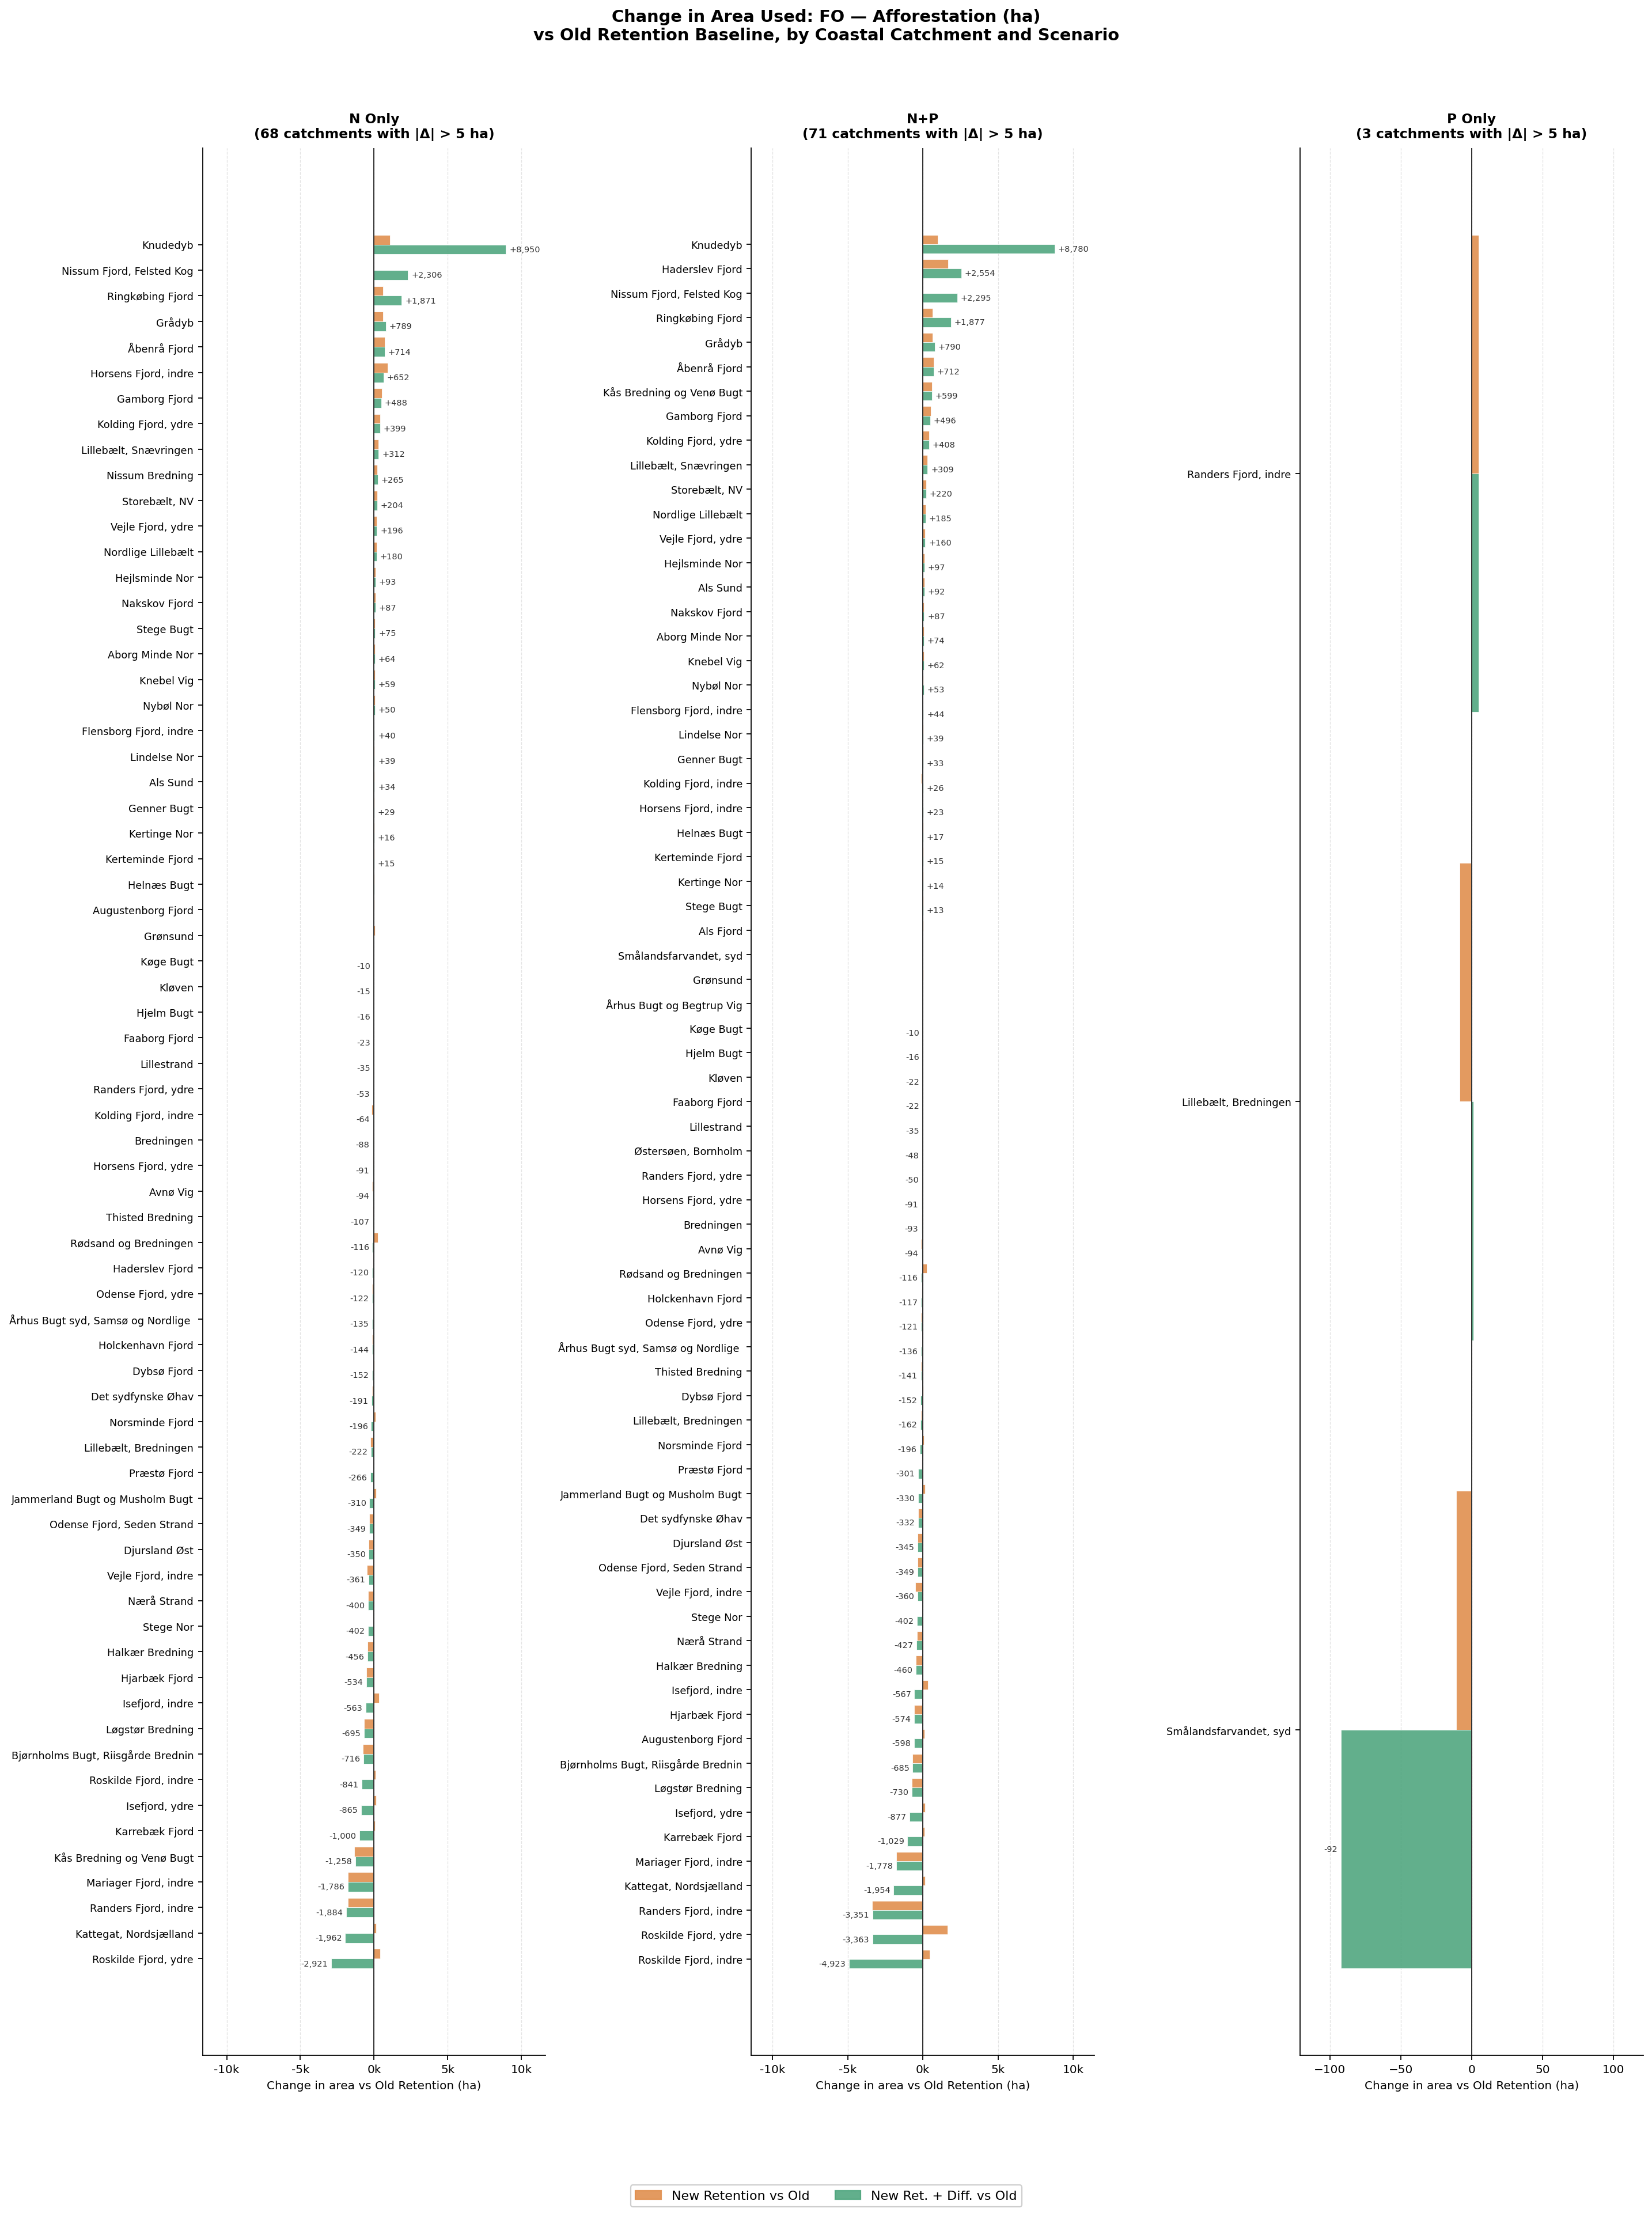
Area change — FO
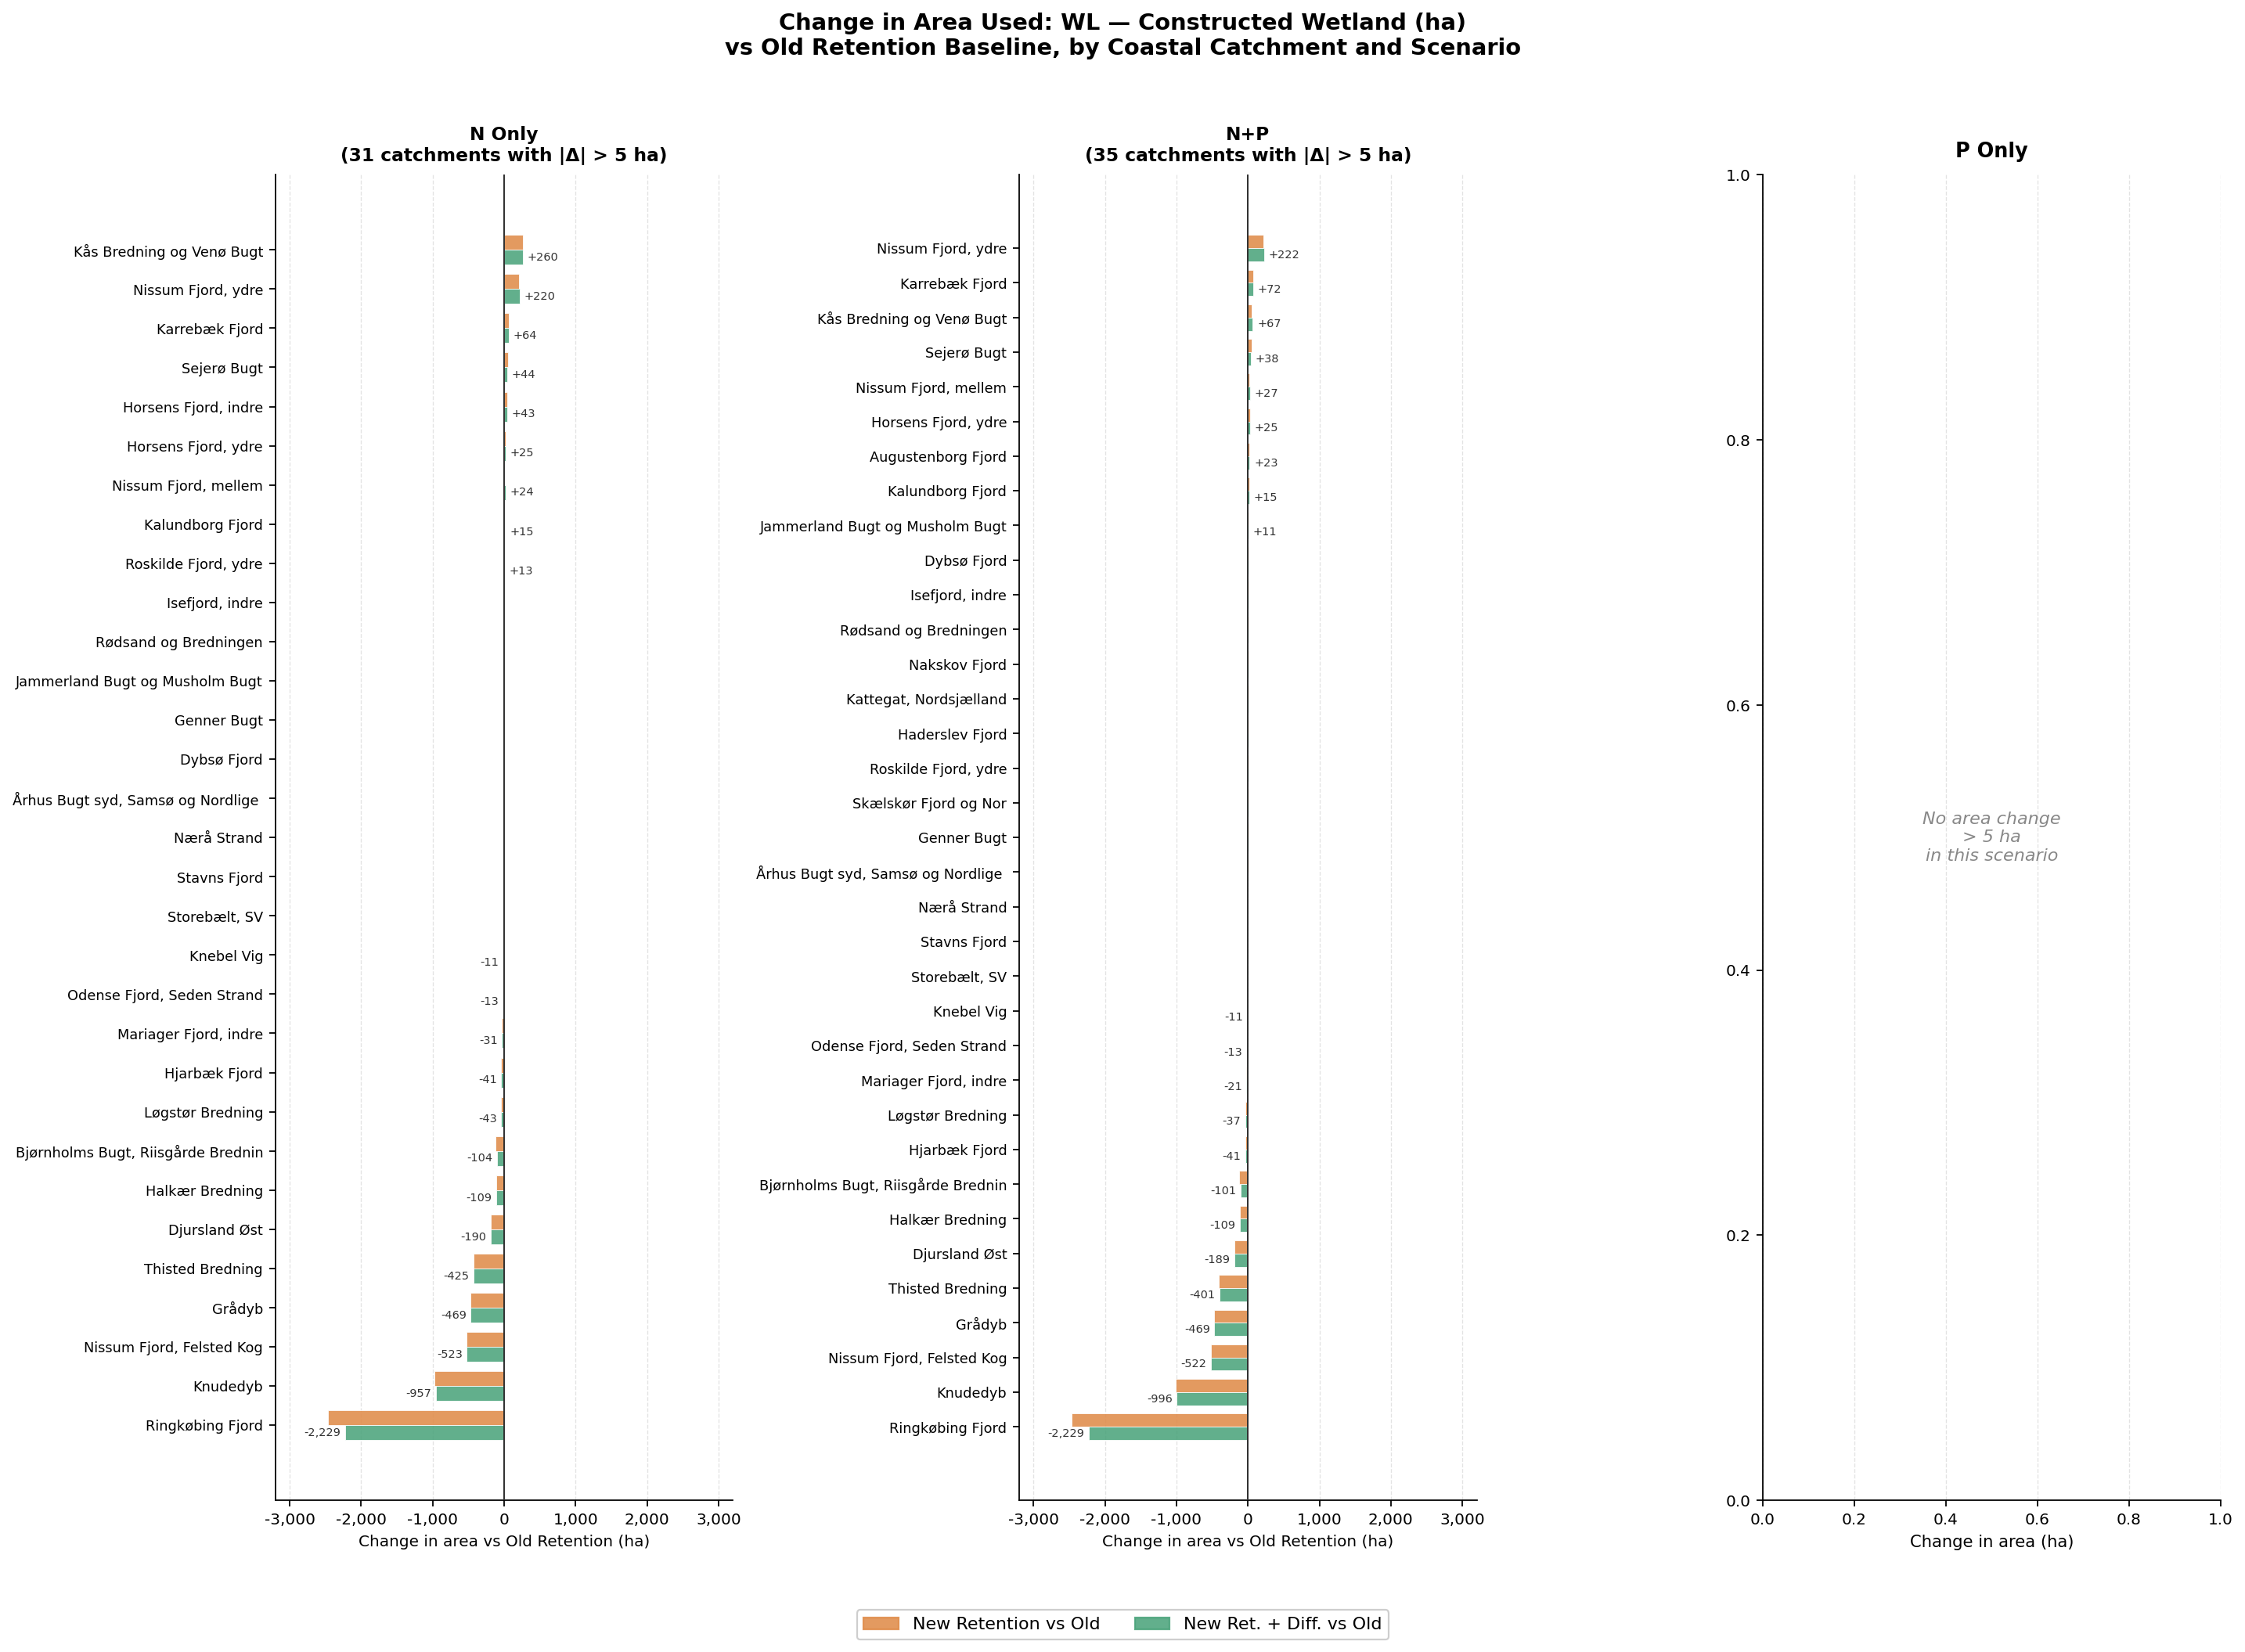
Area change — WL
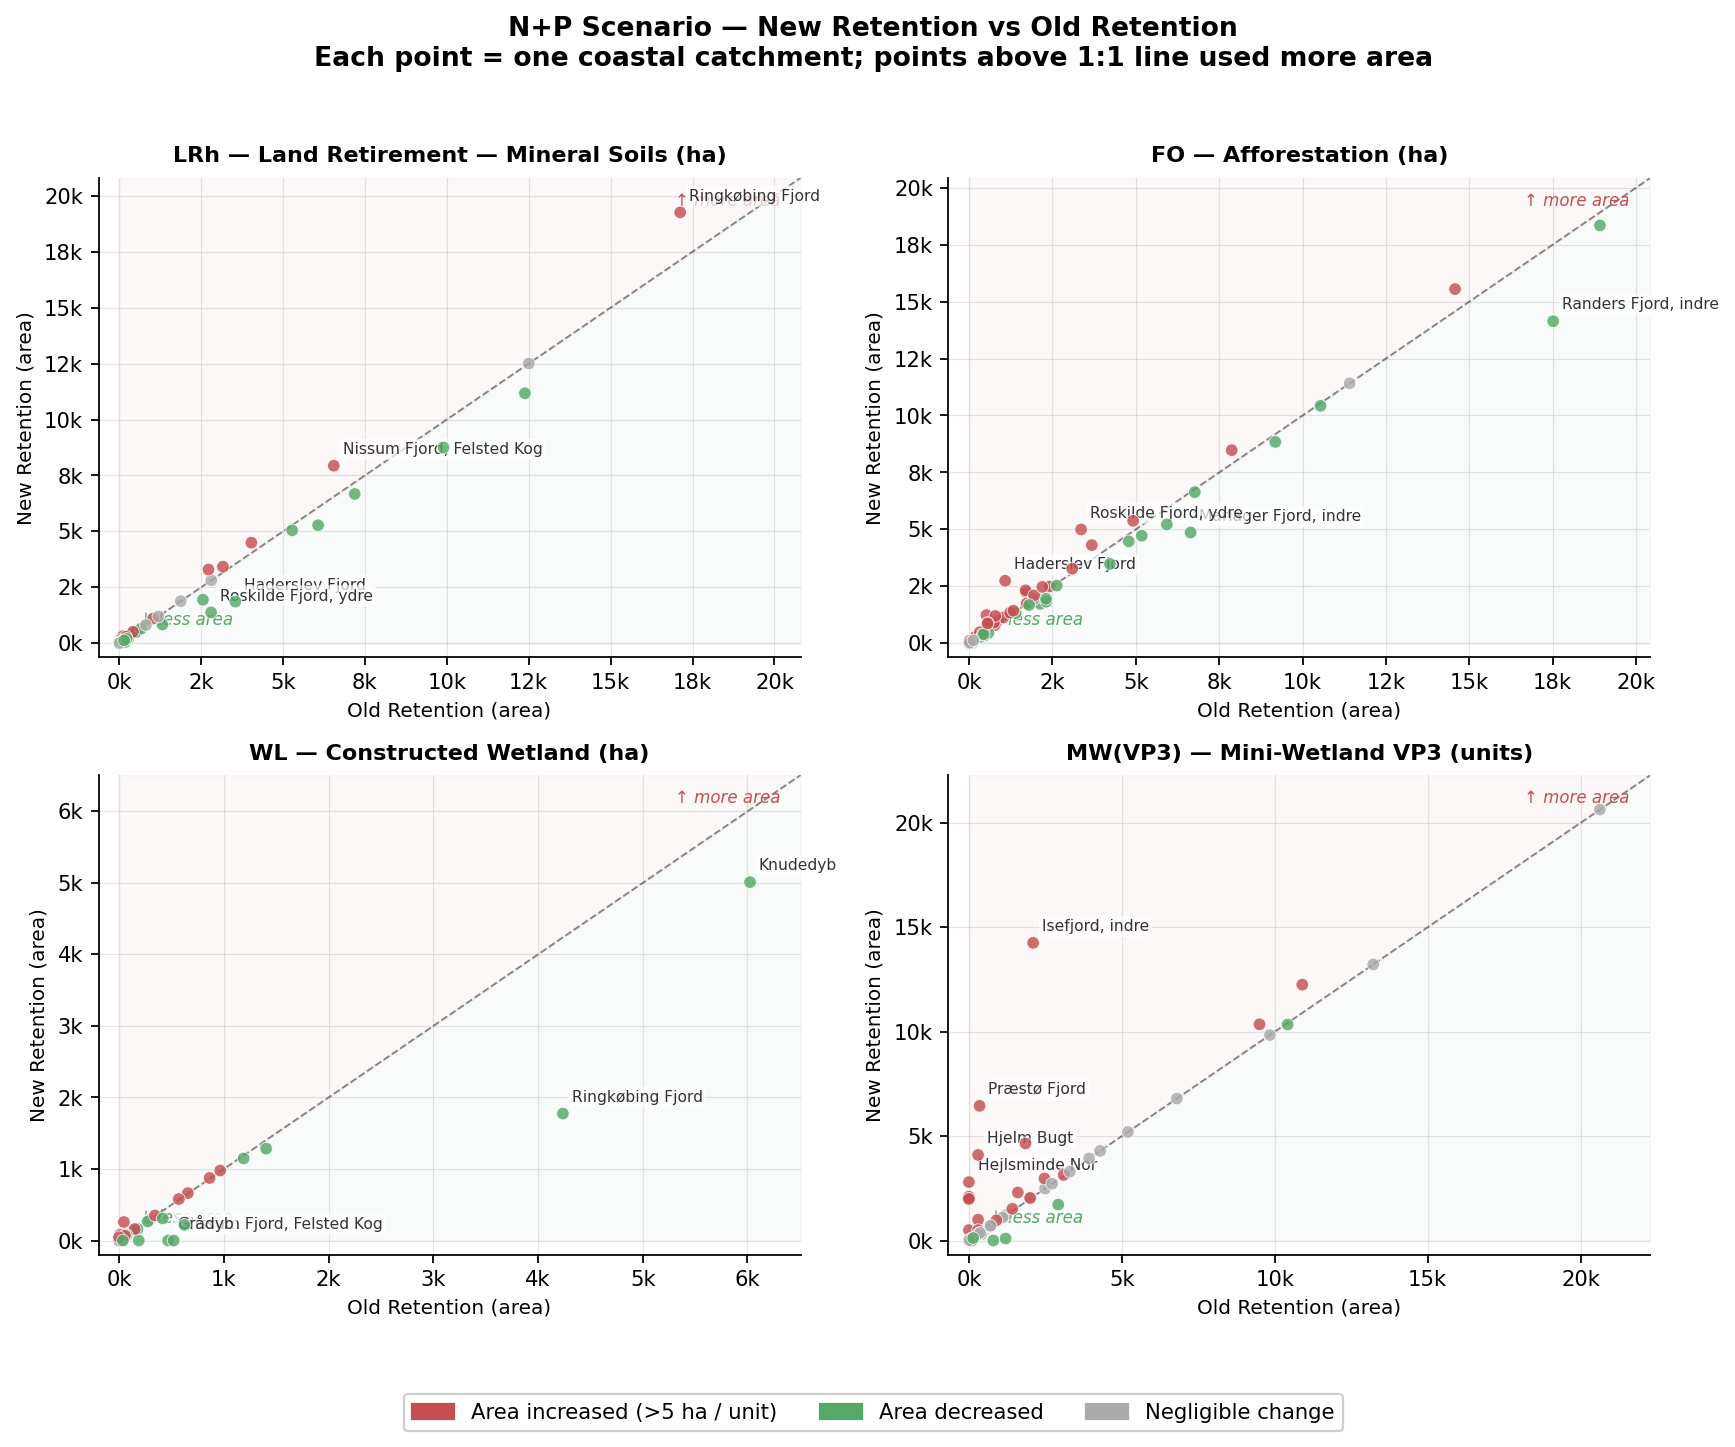
N/P scatter — New vs Old
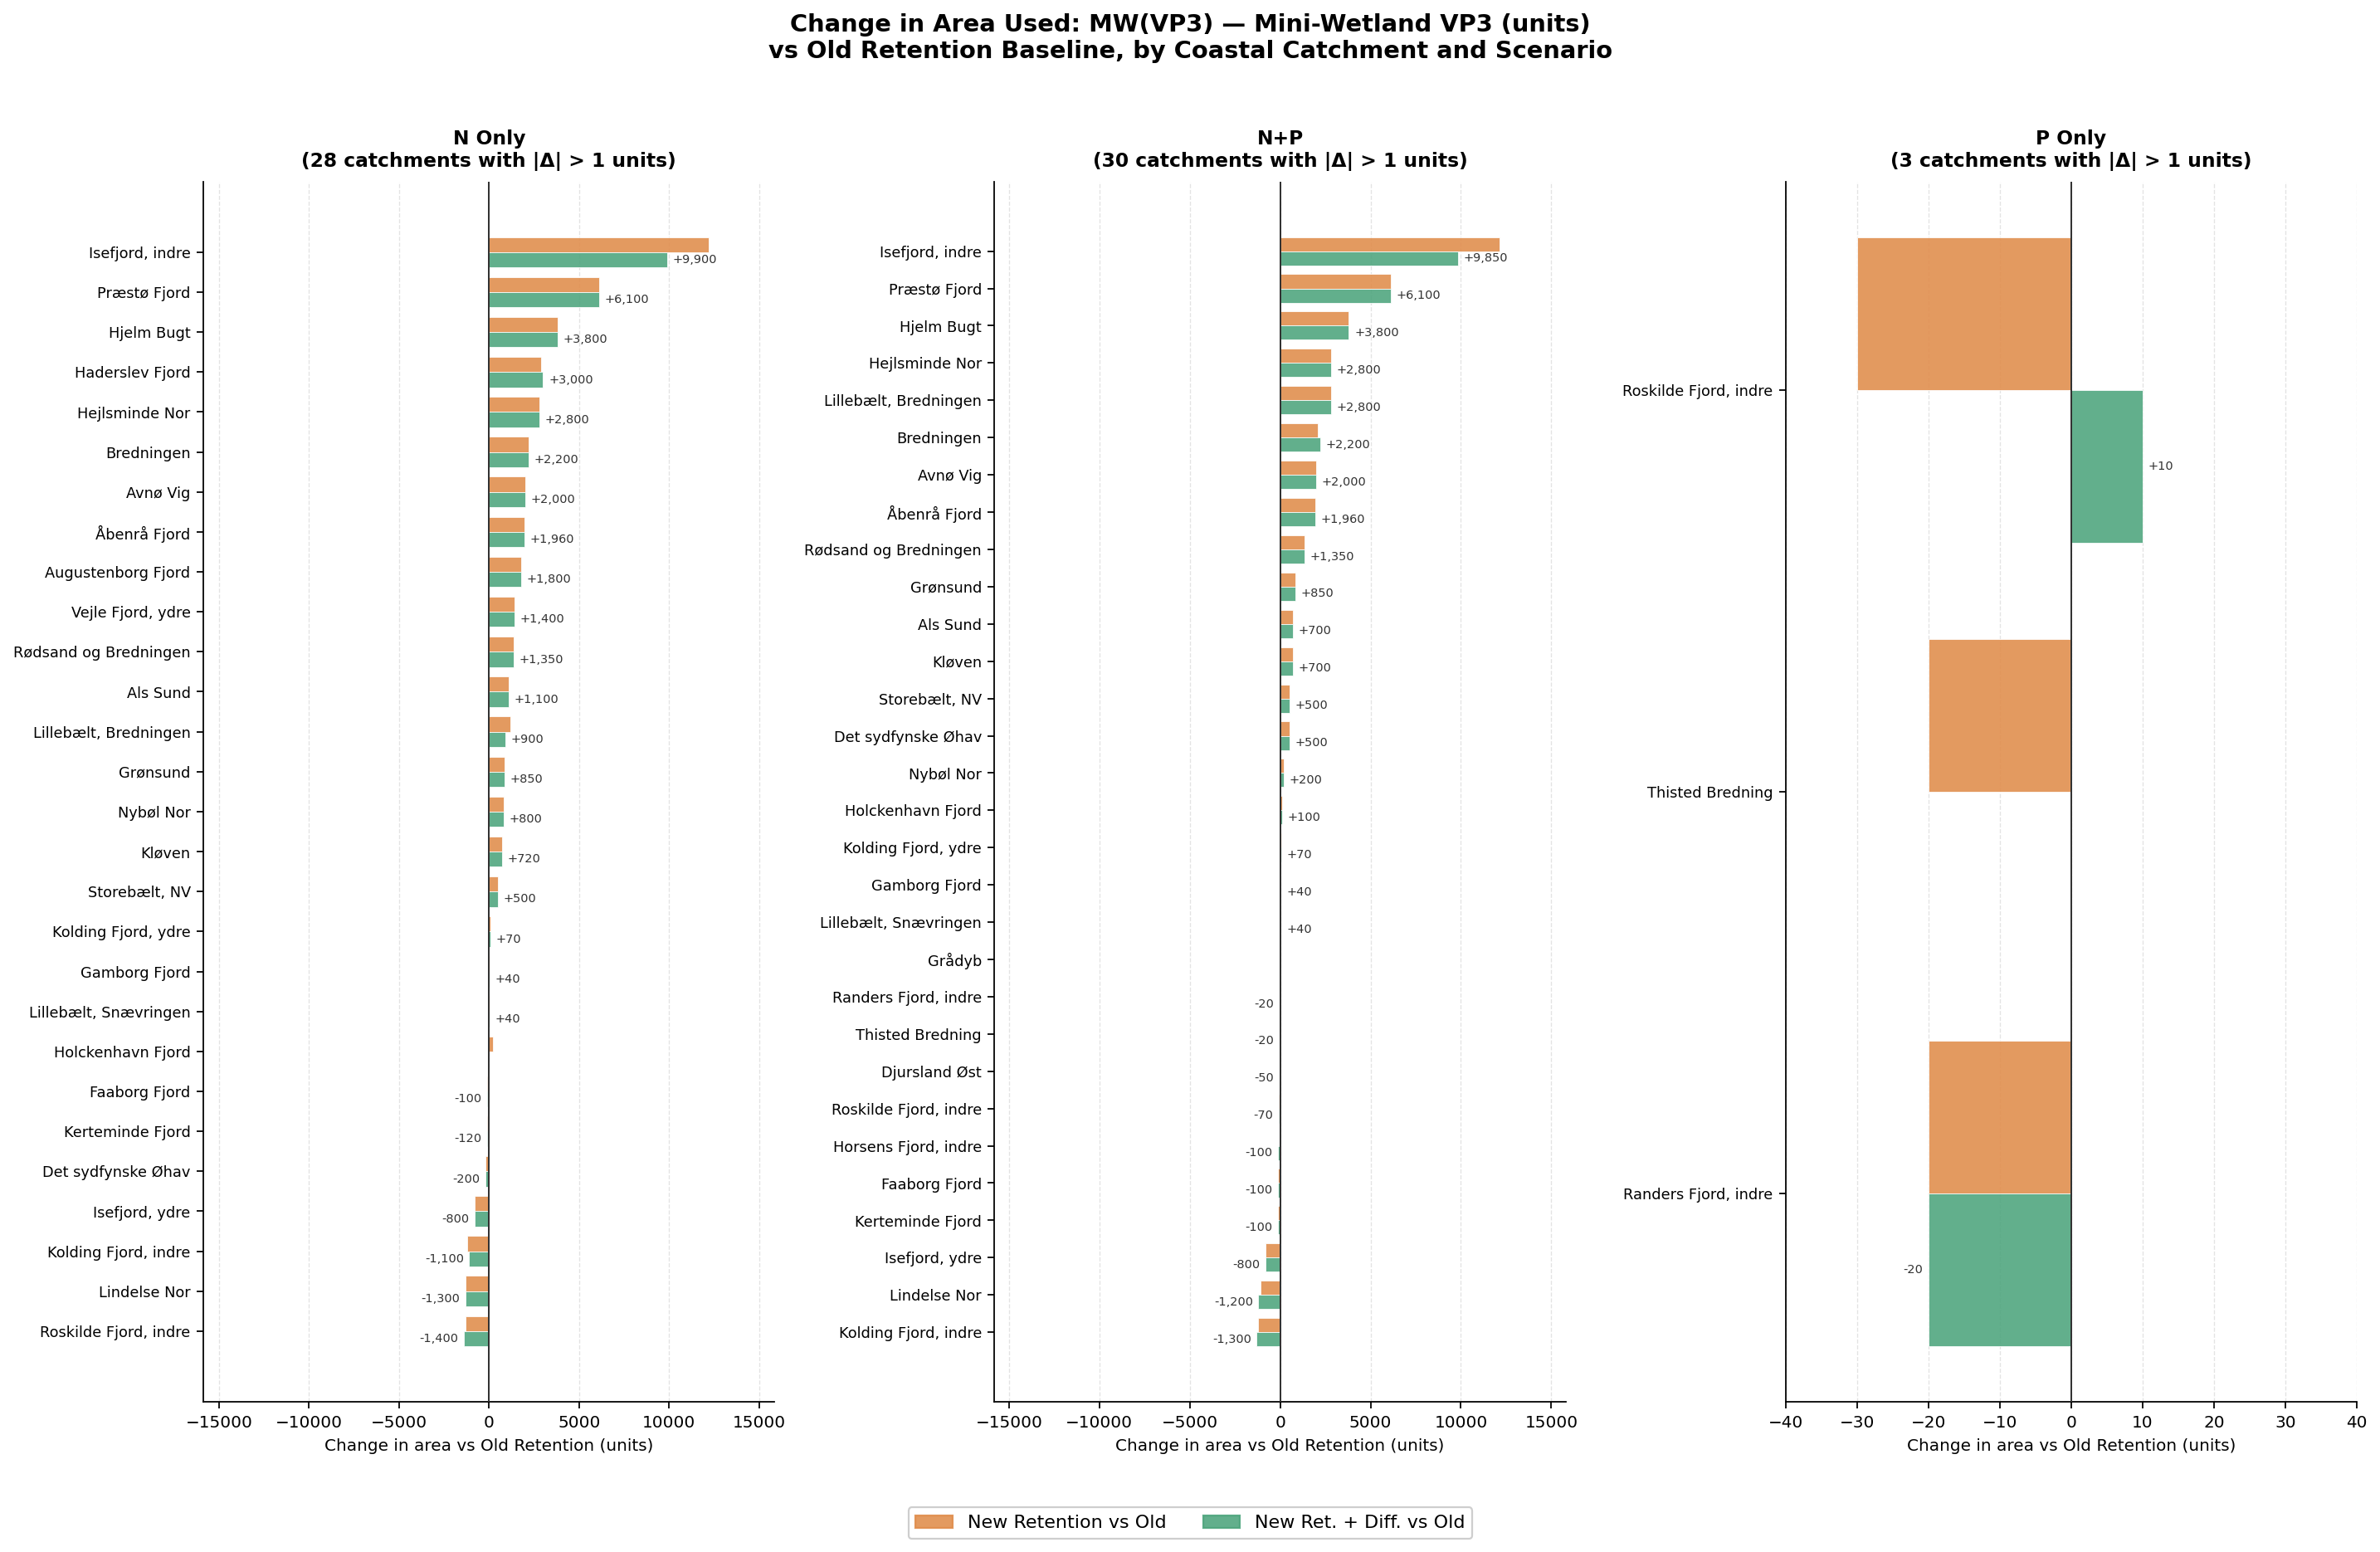
Area change — MW
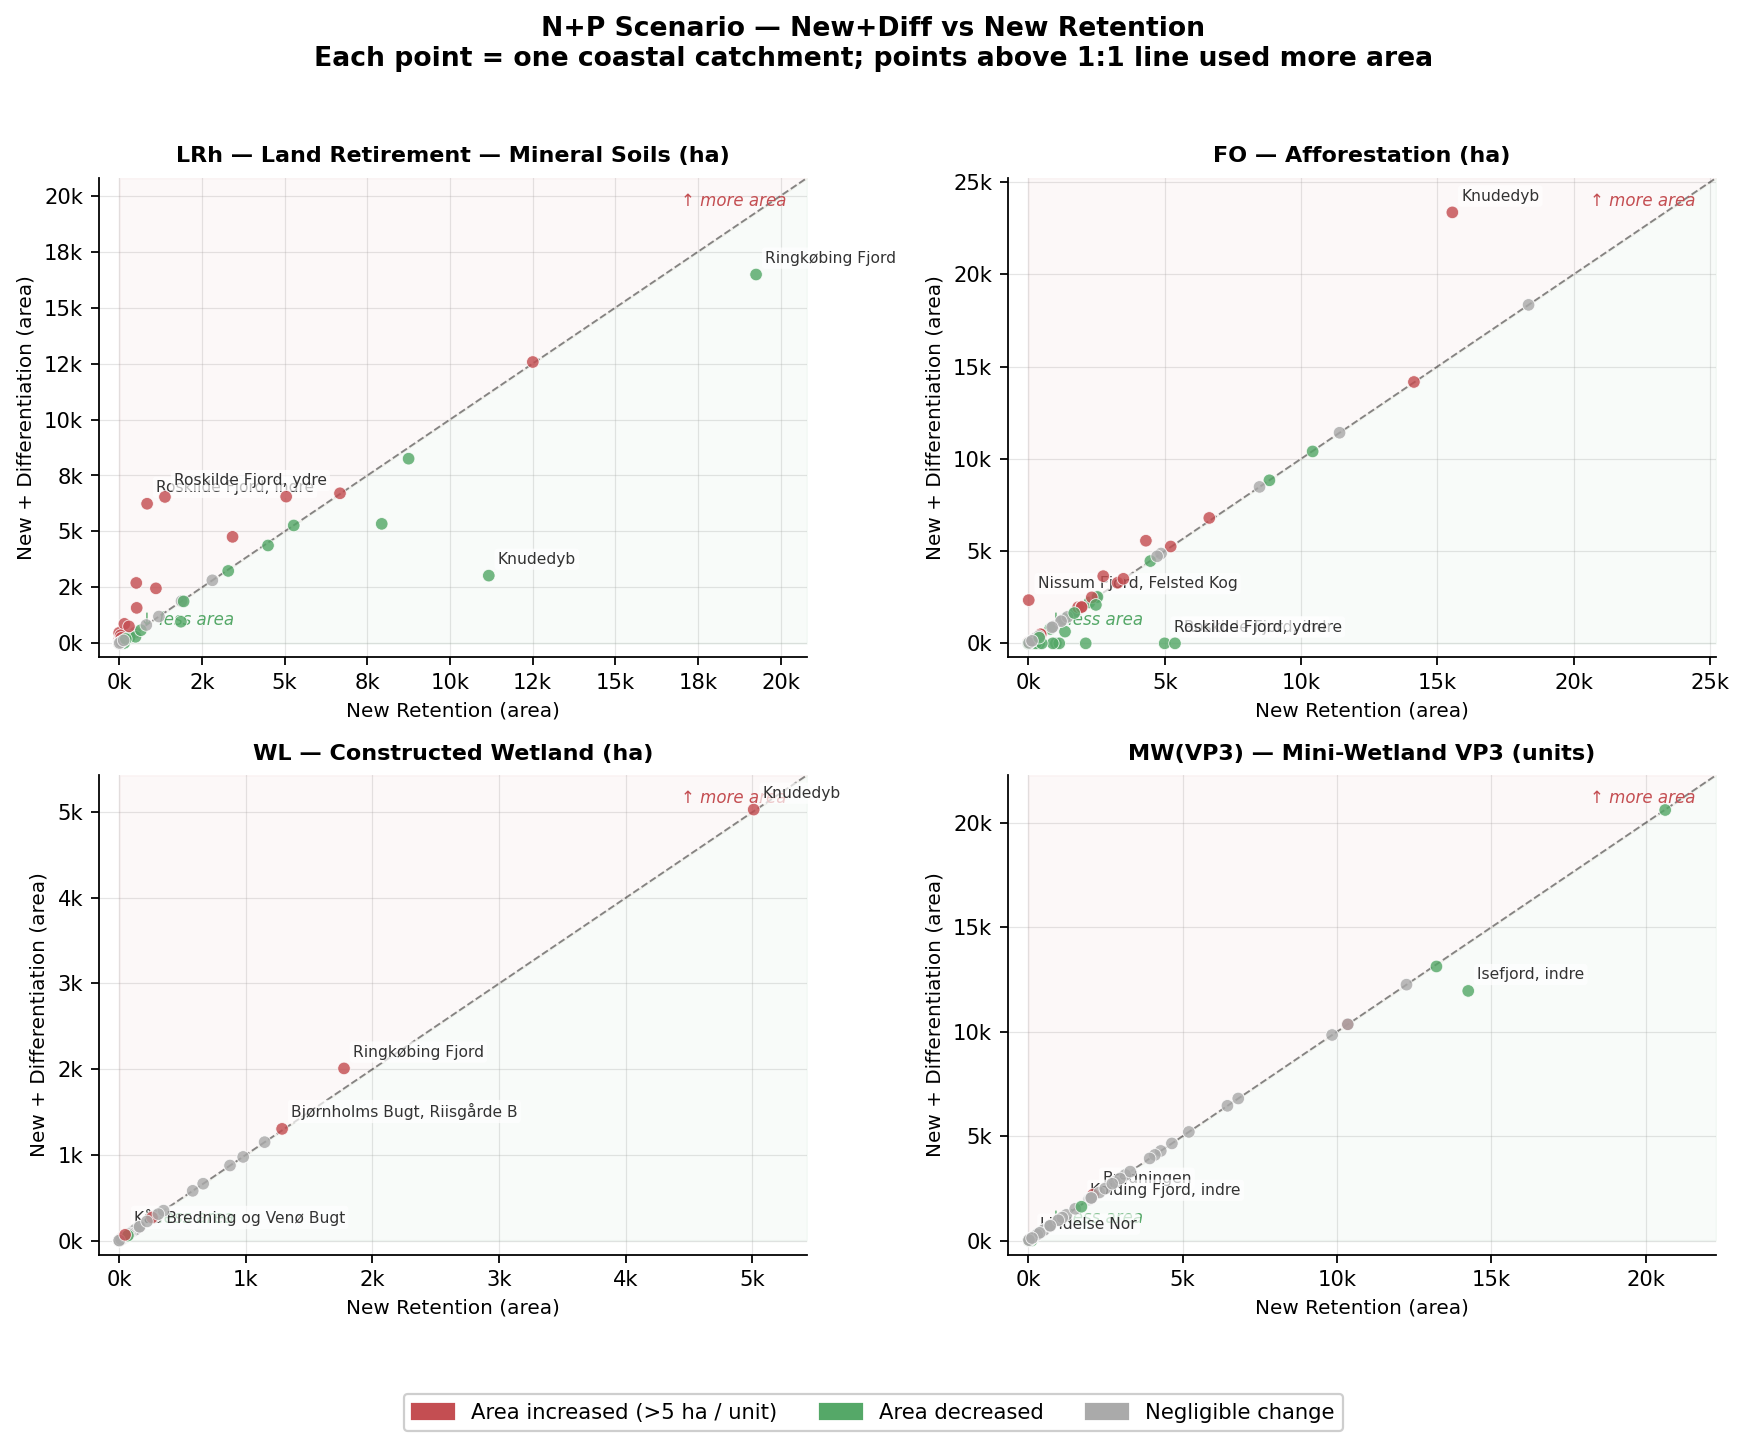
N/P scatter — Diff vs New
Caveats
- This ingest documents workbook outputs as delivered. It does not yet verify every national result against underlying
.gdxfiles or rerun the model. - Catchment-level and lake-level sheets are present in the raw workbooks but are not yet summarized exhaustively here.
- The scenario package mixes target scopes and retention variants inside one project run folder, so this page should be read as a structured result digest rather than as a single model scenario in the narrower wiki/scenario-template sense.